 4
4peptides
spectra
0.000 | 0.023
0.000 | 0.000
0.000 | 0.000
0.000 | 0.180
0.000 | 0.026
0.766 | 1.000
0.000 | 0.000
0.000 | 0.012
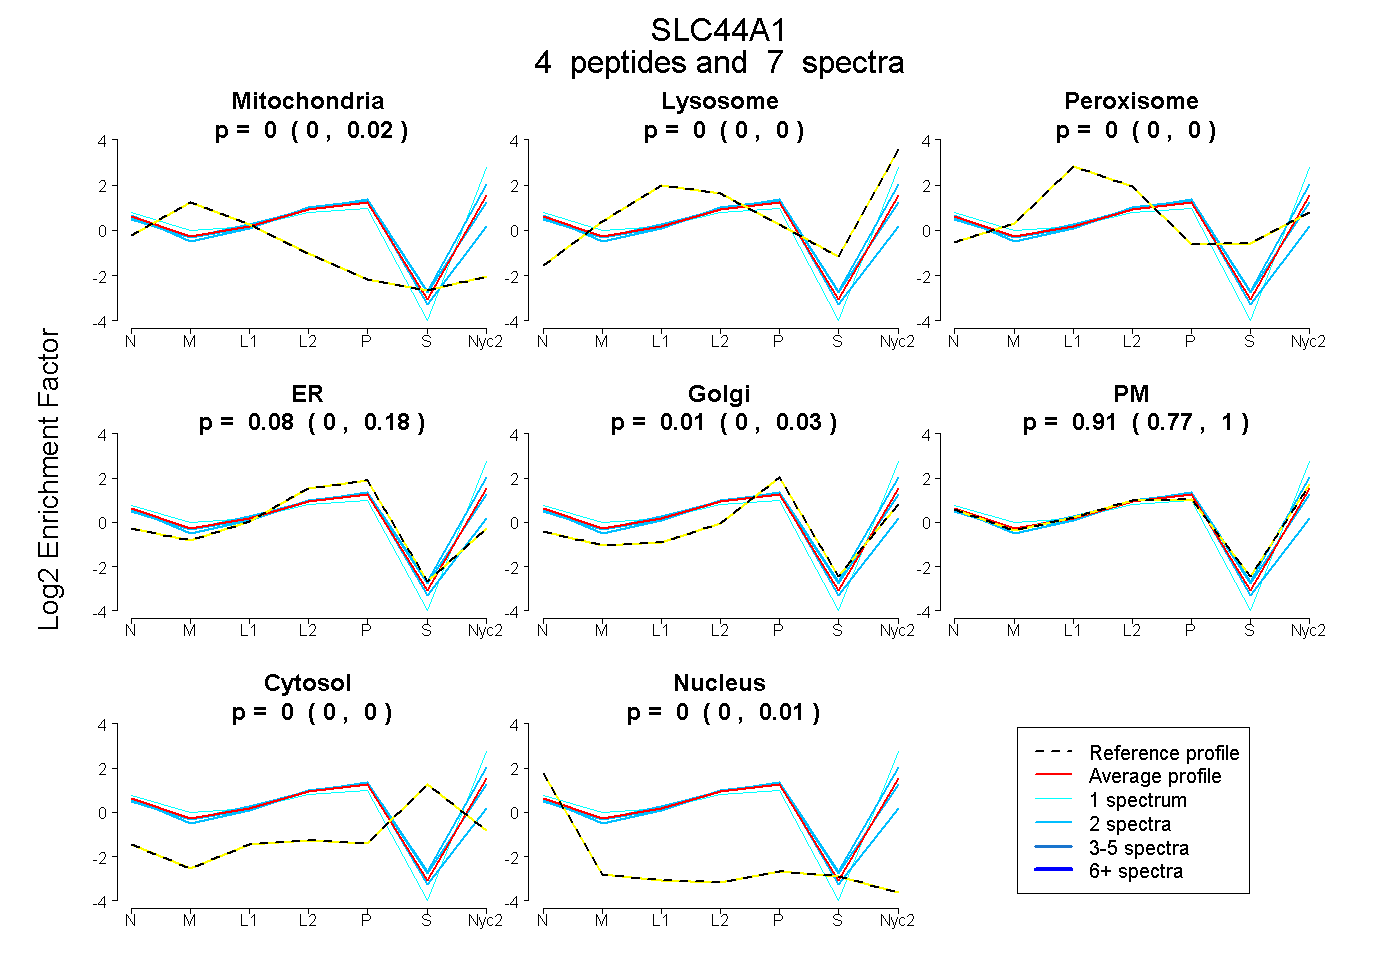
| Plot | Mito | Lyso | Perox | ER | Golgi | PM | Cytosol | Nucleus | |||||
| Expt A |
4 peptides |
7 spectra |
|
0.000 0.000 | 0.023 |
0.000 0.000 | 0.000 |
0.000 0.000 | 0.000 |
0.079 0.000 | 0.180 |
0.008 0.000 | 0.026 |
0.913 0.766 | 1.000 |
0.000 0.000 | 0.000 |
0.001 0.000 | 0.012 |
| 2 spectra, VLMEFVENSR | 0.000 | 0.015 | 0.000 | 0.000 | 0.042 | 0.943 | 0.000 | 0.000 | ||
| 2 spectra, SSAFCPK | 0.000 | 0.000 | 0.000 | 0.181 | 0.004 | 0.799 | 0.000 | 0.016 | ||
| 1 spectrum, DAFVILVENALR | 0.000 | 0.000 | 0.000 | 0.000 | 0.000 | 1.000 | 0.000 | 0.000 | ||
| 2 spectra, SMALCVAACPR | 0.088 | 0.000 | 0.000 | 0.498 | 0.000 | 0.395 | 0.000 | 0.019 |
| Plot | Lyso | Other | |||||||||||
| Expt C |
6 peptides |
13 spectra |
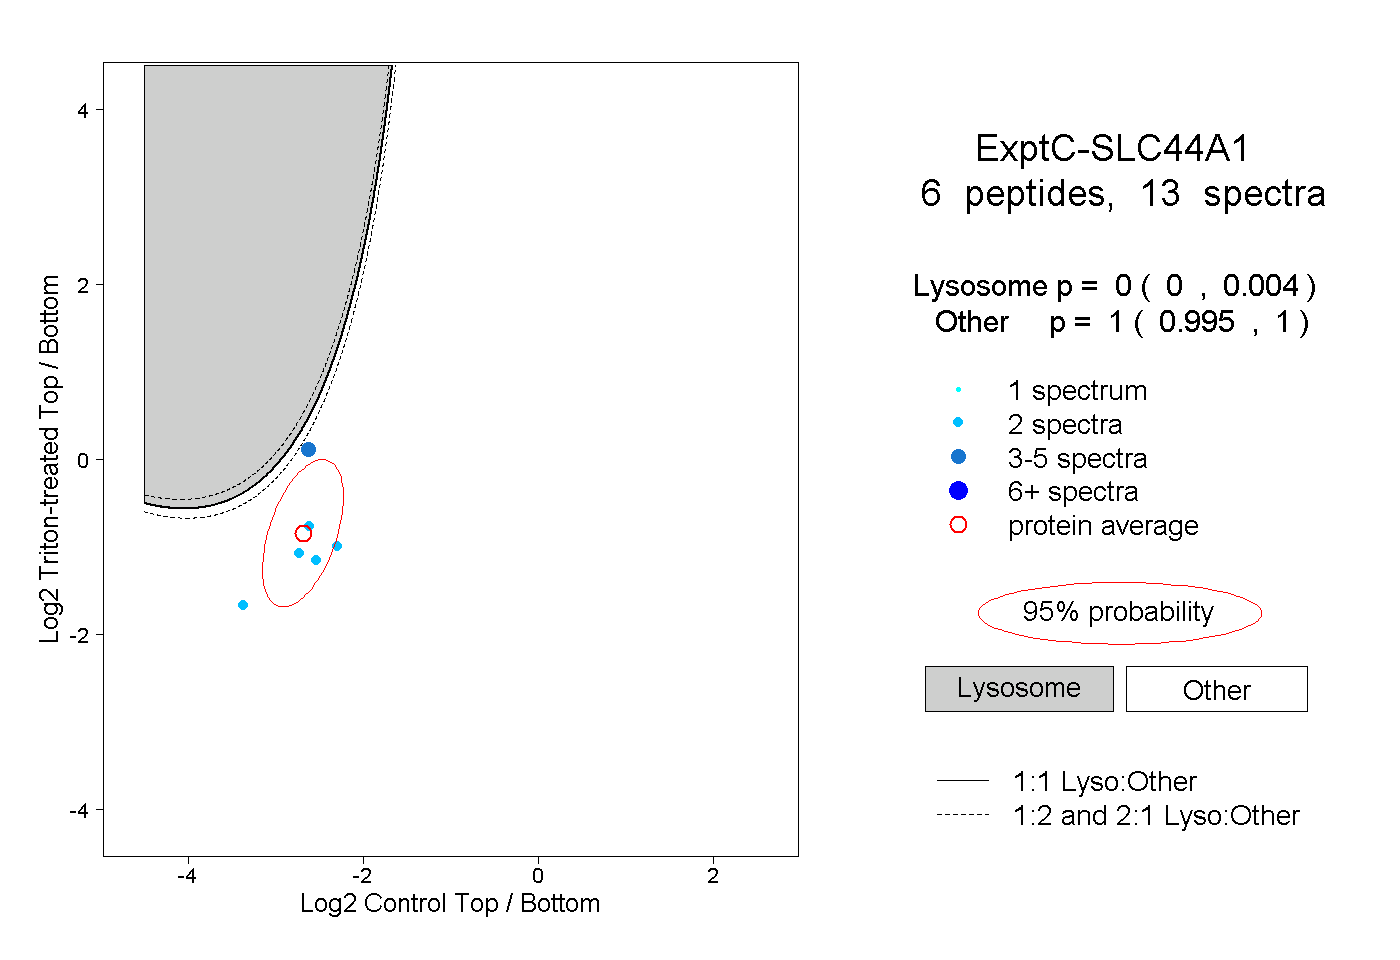 |
0.000 0.000 | 0.004 |
1.000 0.995 | 1.000 |