 4
4peptides
spectra
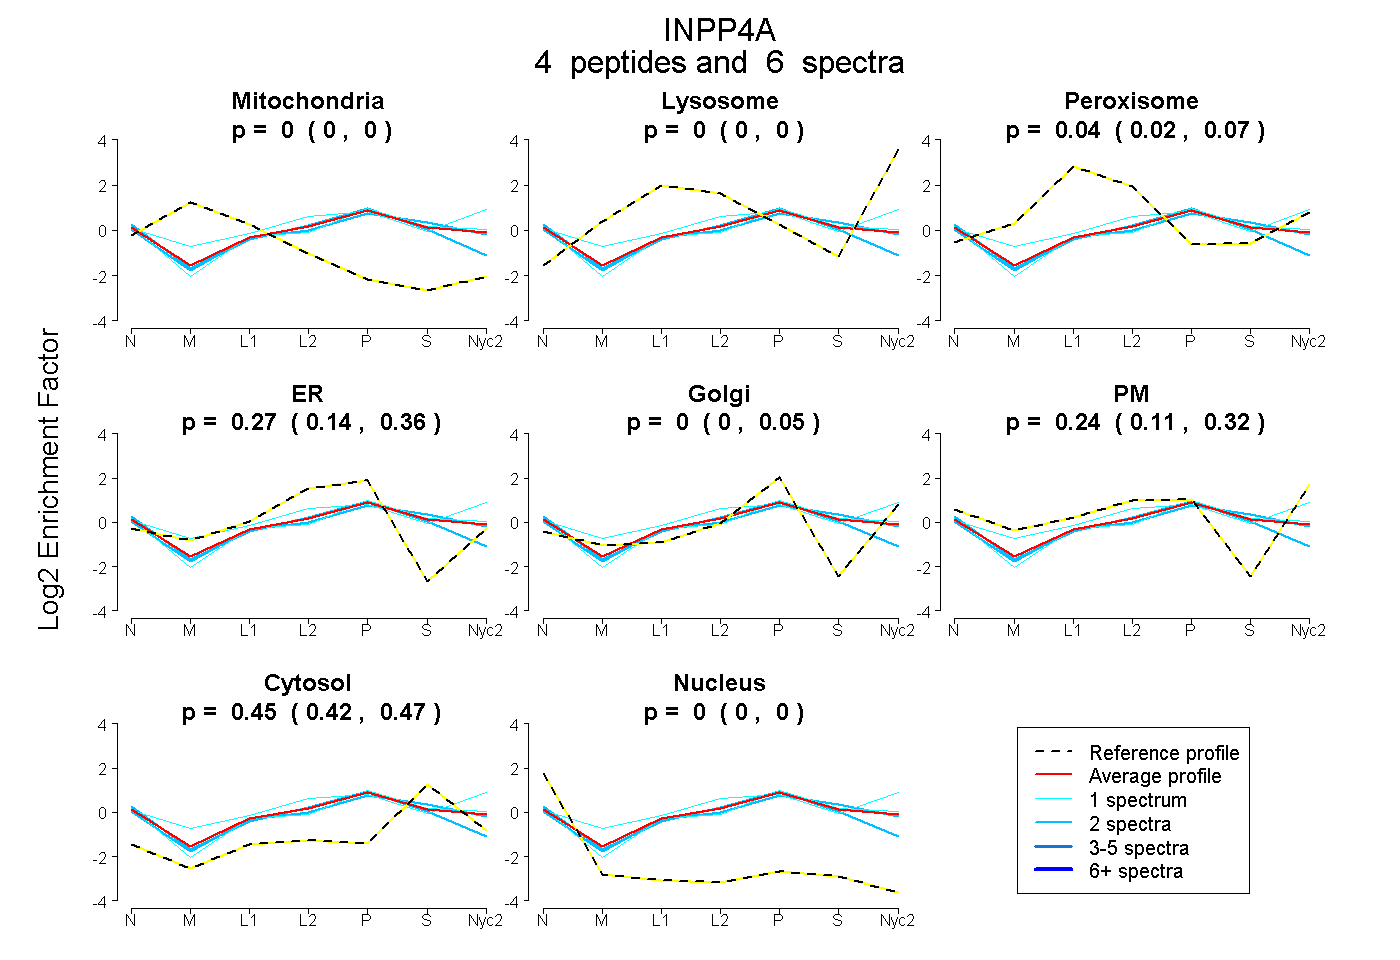
0.000 | 0.000
0.000 | 0.000
0.021 | 0.068
0.144 | 0.362
0.000 | 0.054
0.113 | 0.318
0.425 | 0.469
0.000 | 0.000
| Plot | Mito | Lyso | Perox | ER | Golgi | PM | Cytosol | Nucleus | |||||
| Expt A |
4 peptides |
6 spectra |
|
0.000 0.000 | 0.000 |
0.000 0.000 | 0.000 |
0.044 0.021 | 0.068 |
0.270 0.144 | 0.362 |
0.000 0.000 | 0.054 |
0.236 0.113 | 0.318 |
0.450 0.425 | 0.469 |
0.000 0.000 | 0.000 |
| 2 spectra, LLLEEDAAR | 0.000 | 0.000 | 0.044 | 0.252 | 0.000 | 0.194 | 0.511 | 0.000 | ||
| 1 spectrum, SDQQPPVTR | 0.000 | 0.000 | 0.006 | 0.186 | 0.076 | 0.255 | 0.478 | 0.000 | ||
| 1 spectrum, VWLNVDK | 0.000 | 0.043 | 0.131 | 0.000 | 0.074 | 0.444 | 0.307 | 0.000 | ||
| 2 spectra, EVLPEDCLPR | 0.000 | 0.000 | 0.005 | 0.521 | 0.000 | 0.000 | 0.463 | 0.011 |
| Plot | Lyso | Other | |||||||||||
| Expt C |
5 peptides |
7 spectra |
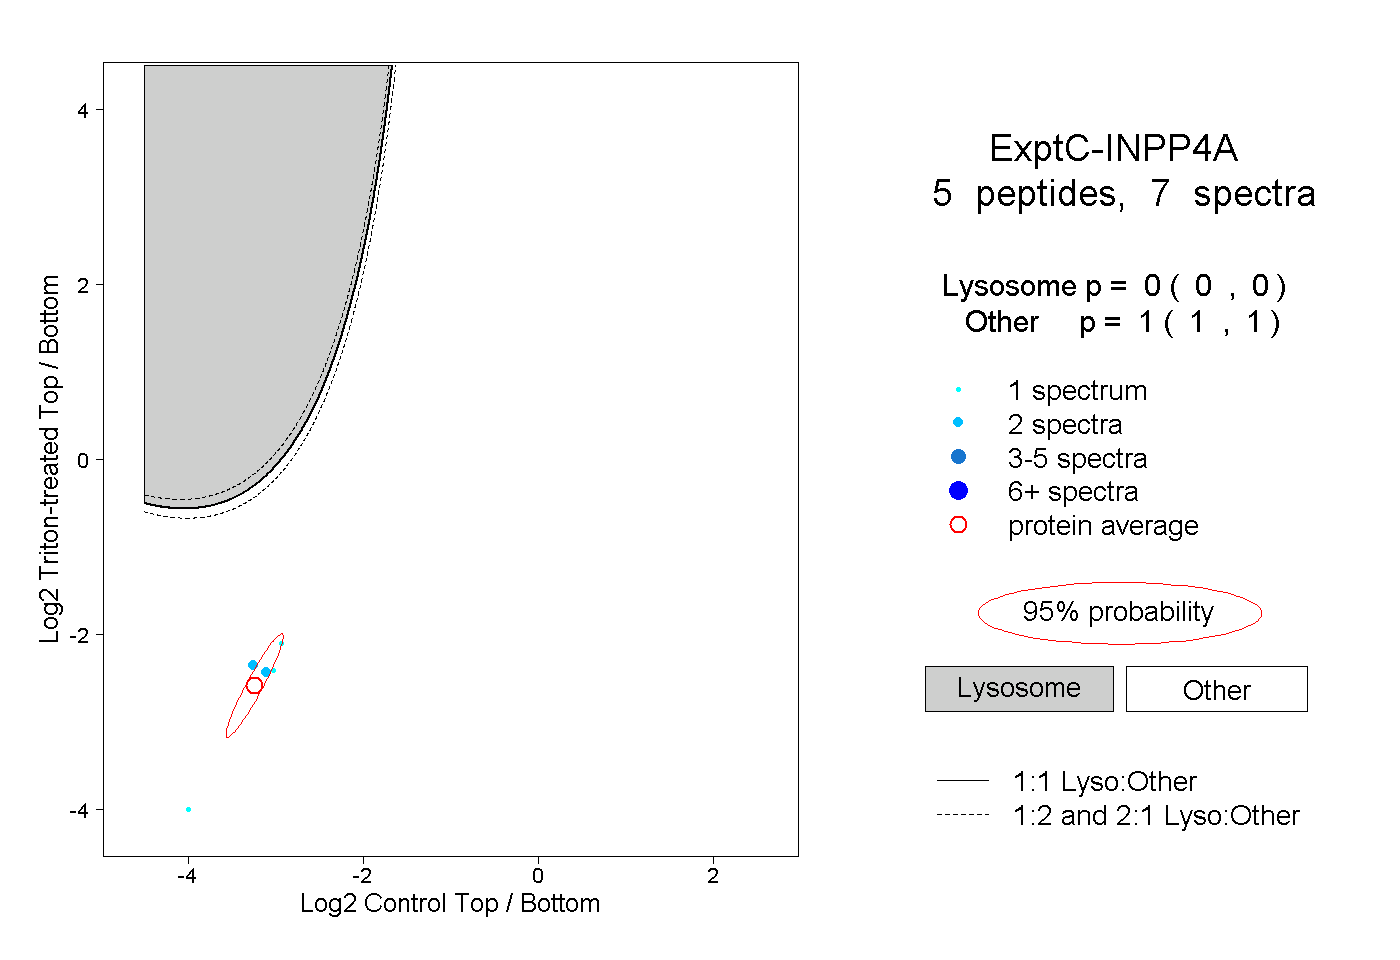 |
0.000 0.000 | 0.000 |
1.000 1.000 | 1.000 |