19
19peptides
spectra
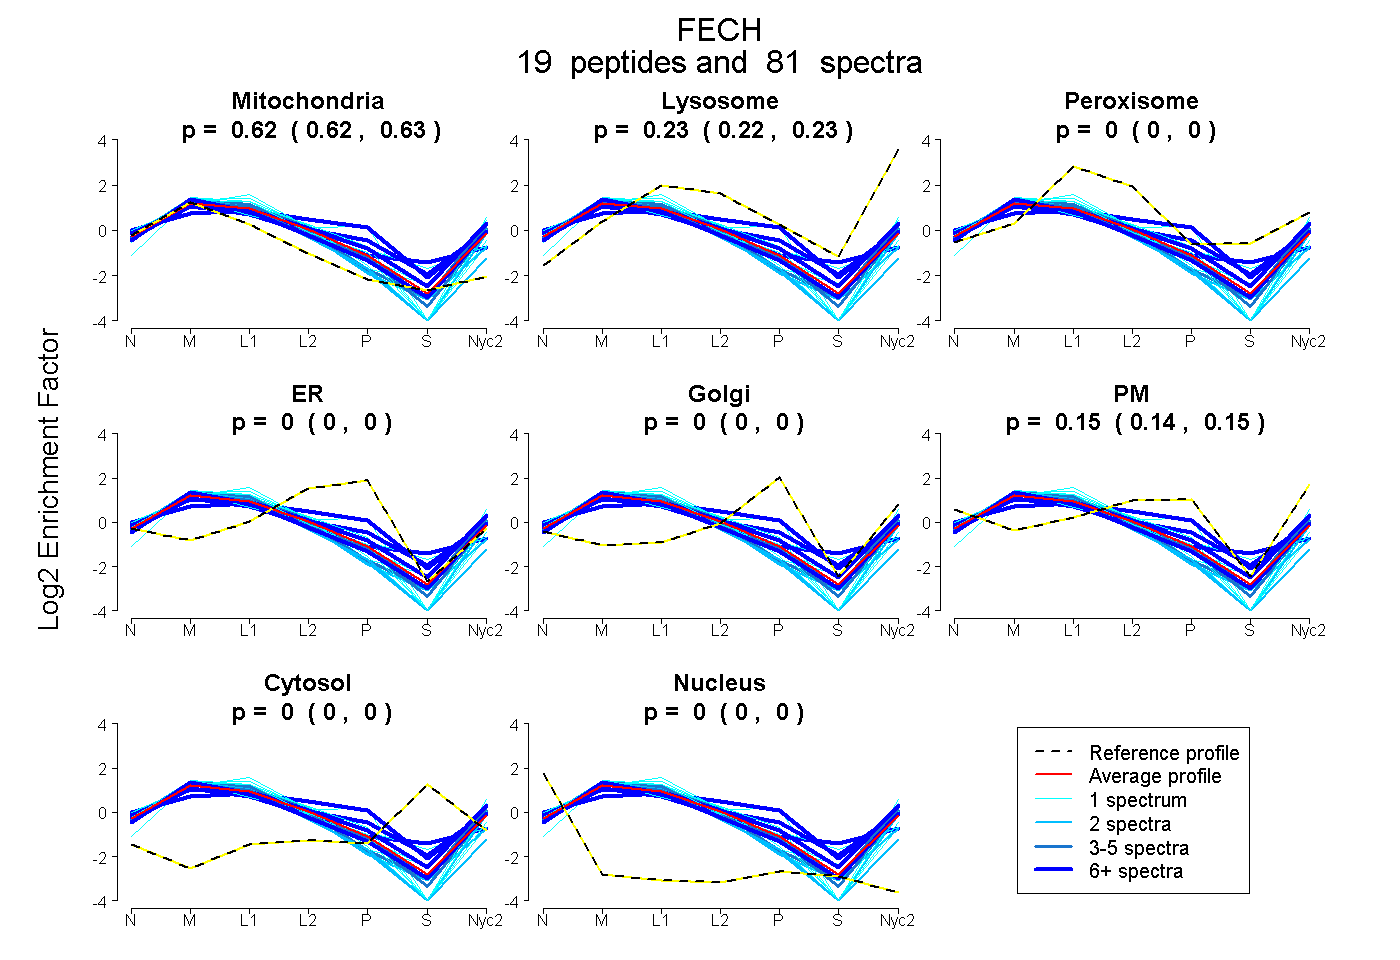
0.618 | 0.626
0.224 | 0.234
0.000 | 0.000
0.000 | 0.000
0.000 | 0.000
0.141 | 0.155
0.000 | 0.000
0.000 | 0.000
12peptides
spectra
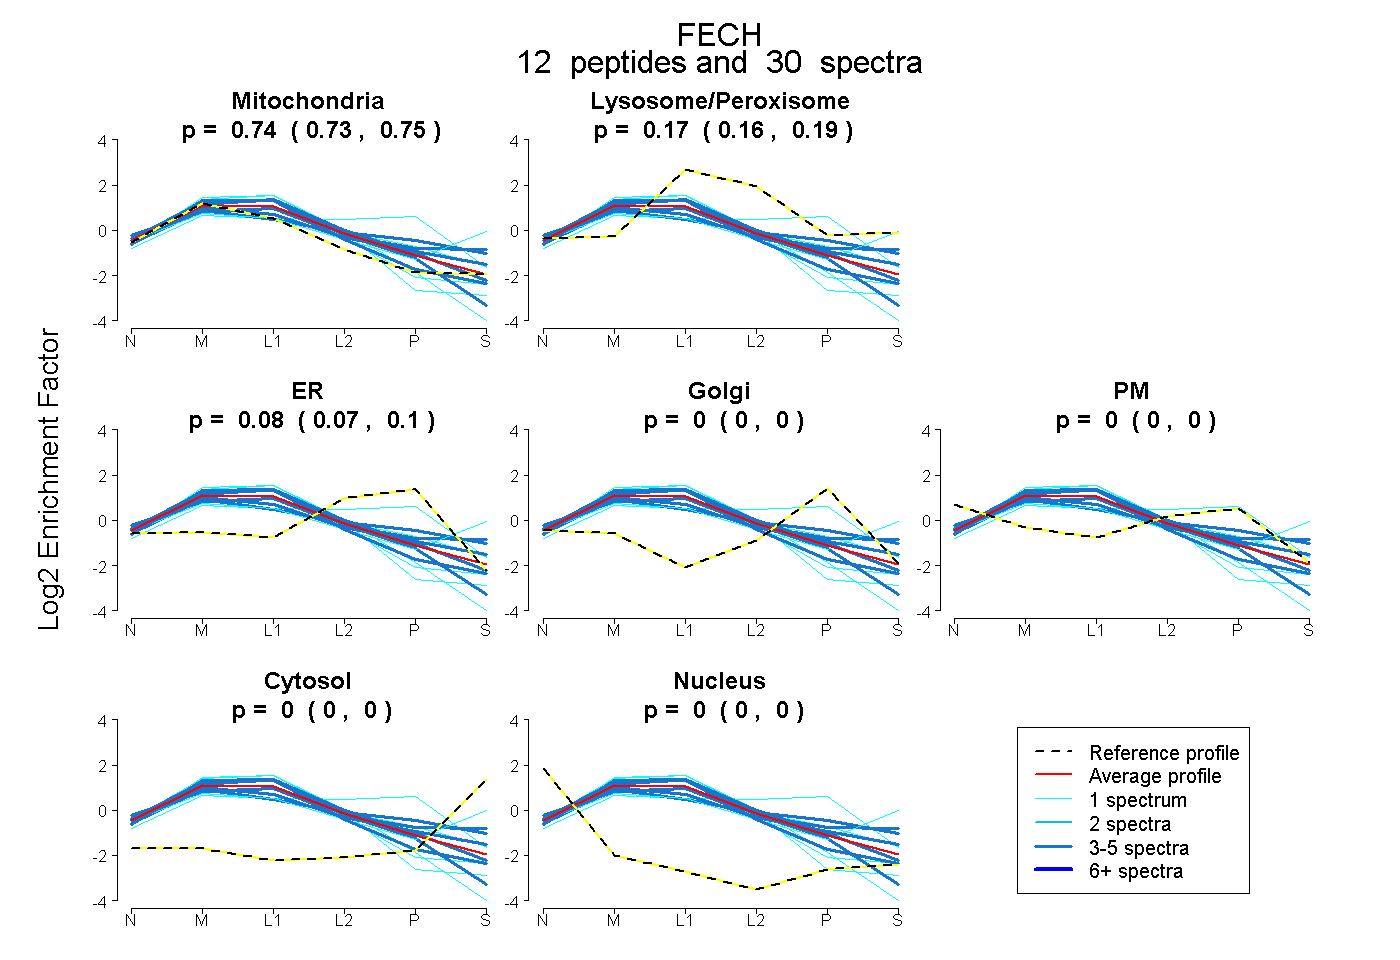
0.732 | 0.755
0.156 | 0.186
0.066 | 0.096
0.000 | 0.000
0.000 | 0.000
0.000 | 0.000
0.000 | 0.000
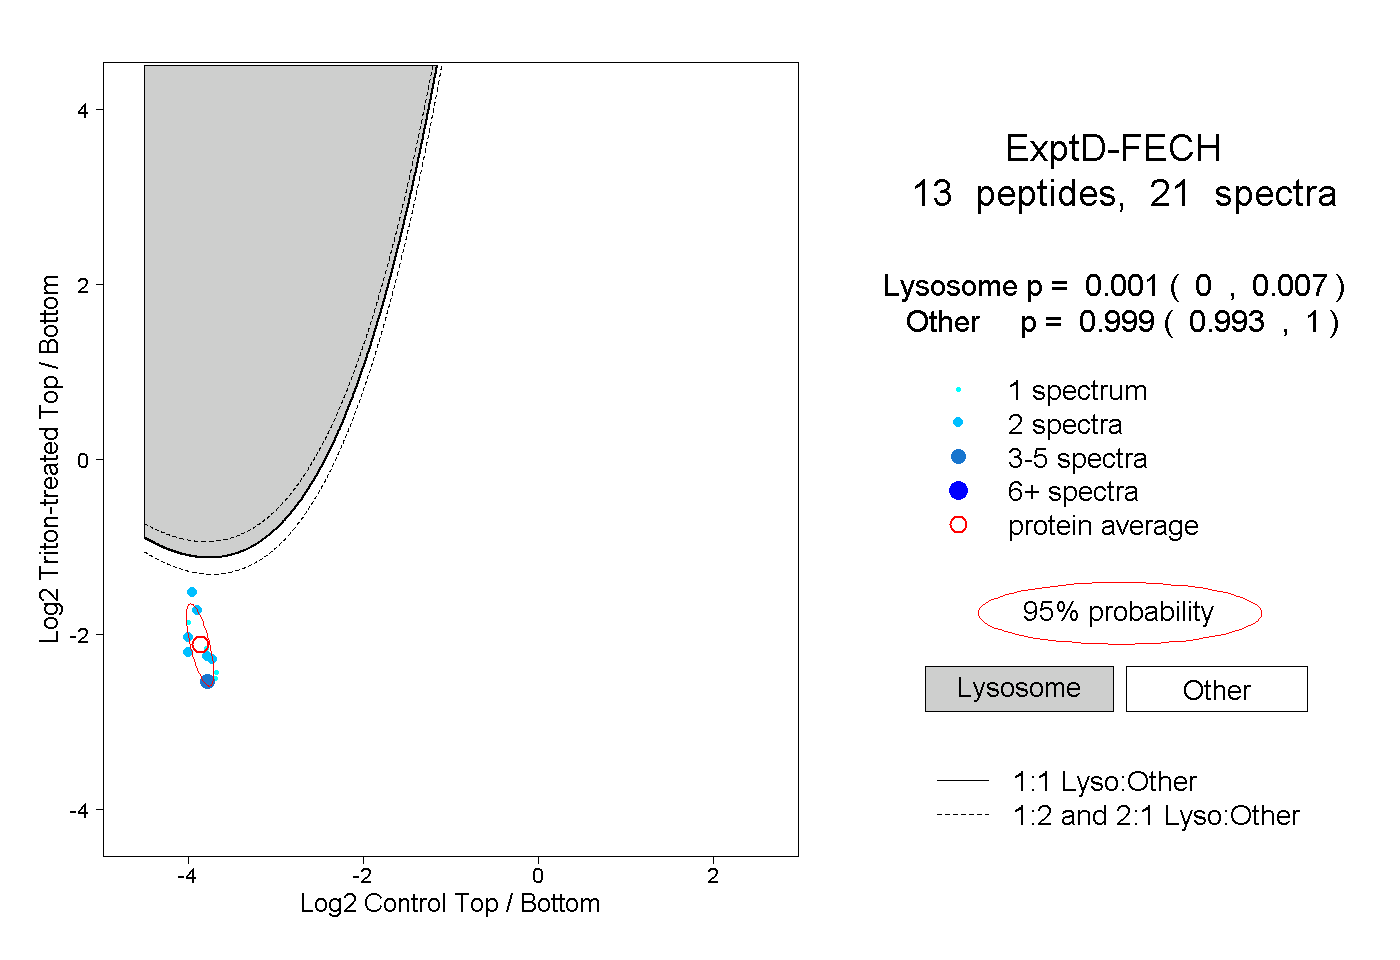
20peptides
spectra
0.000 | 0.000
1.000 | 1.000