 19
19peptides
spectra
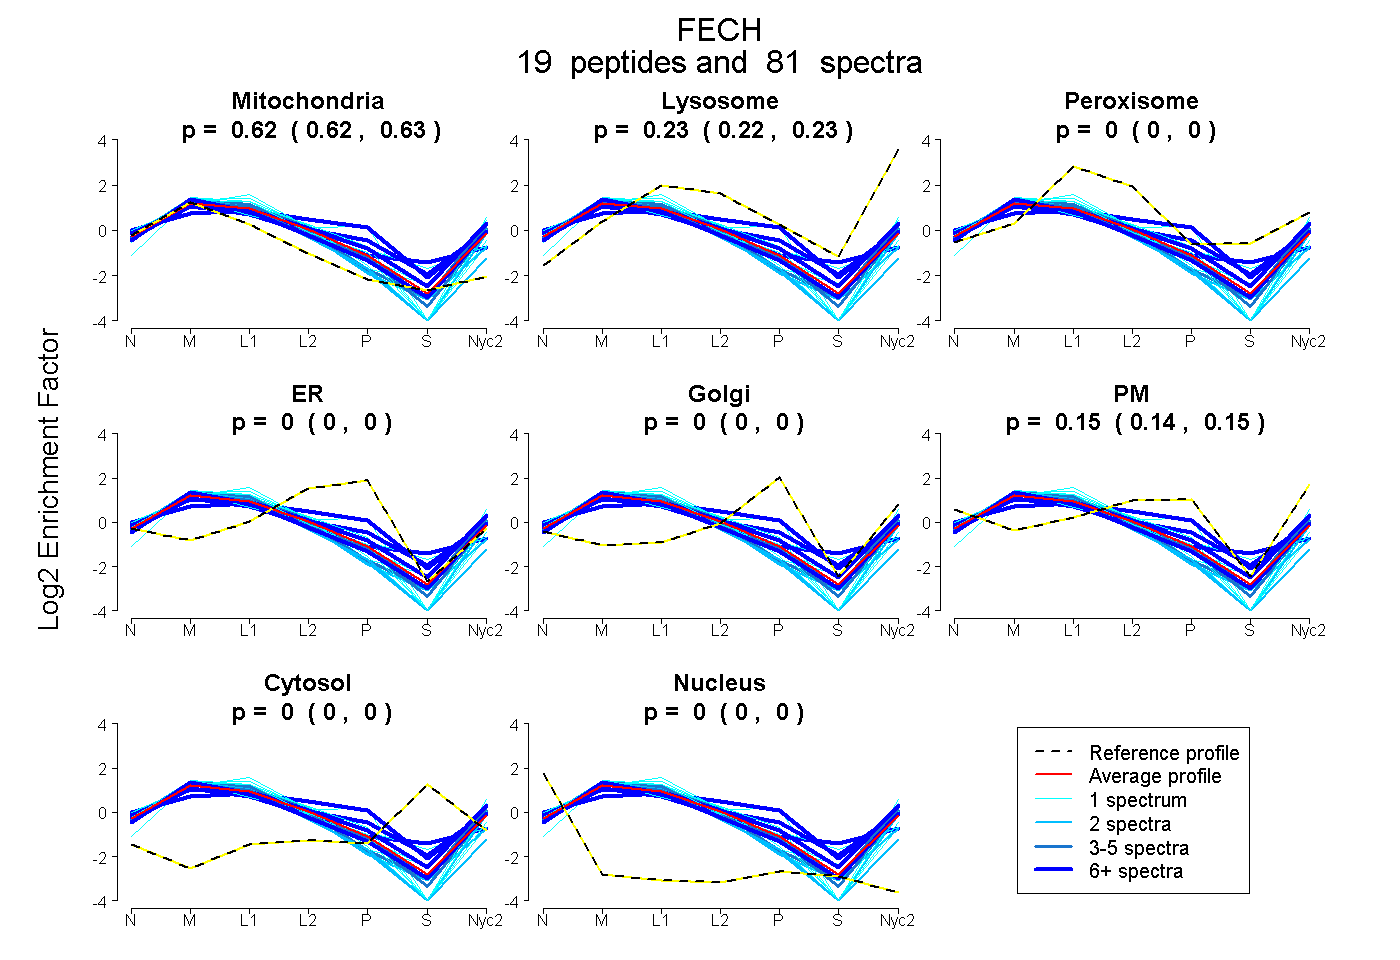
0.618 | 0.626
0.224 | 0.234
0.000 | 0.000
0.000 | 0.000
0.000 | 0.000
0.141 | 0.155
0.000 | 0.000
0.000 | 0.000
| Plot | Mito | Lyso | Perox | ER | Golgi | PM | Cytosol | Nucleus | |||||
| Expt A |
19 peptides |
81 spectra |
|
0.622 0.618 | 0.626 |
0.229 0.224 | 0.234 |
0.000 0.000 | 0.000 |
0.000 0.000 | 0.000 |
0.000 0.000 | 0.000 |
0.149 0.141 | 0.155 |
0.000 0.000 | 0.000 |
0.000 0.000 | 0.000 |
| 8 spectra, YYNEVGR | 0.664 | 0.252 | 0.000 | 0.000 | 0.000 | 0.083 | 0.000 | 0.000 | ||
| 5 spectra, YYIGFR | 0.630 | 0.241 | 0.000 | 0.000 | 0.000 | 0.129 | 0.000 | 0.000 | ||
| 9 spectra, CGAENIR | 0.566 | 0.068 | 0.254 | 0.000 | 0.059 | 0.000 | 0.052 | 0.000 | ||
| 2 spectra, DLMTLPIQNK | 0.788 | 0.199 | 0.014 | 0.000 | 0.000 | 0.000 | 0.000 | 0.000 | ||
| 1 spectrum, ELDHFPEEK | 0.519 | 0.000 | 0.278 | 0.040 | 0.000 | 0.157 | 0.006 | 0.000 | ||
| 5 spectra, LLDELSPDTAPHK | 0.621 | 0.217 | 0.000 | 0.000 | 0.000 | 0.162 | 0.000 | 0.000 | ||
| 1 spectrum, LAPFIAK | 0.574 | 0.319 | 0.000 | 0.000 | 0.000 | 0.107 | 0.000 | 0.000 | ||
| 12 spectra, IQEQYR | 0.491 | 0.182 | 0.105 | 0.000 | 0.083 | 0.139 | 0.000 | 0.000 | ||
| 1 spectrum, WSTIDR | 0.617 | 0.155 | 0.000 | 0.000 | 0.000 | 0.228 | 0.000 | 0.000 | ||
| 3 spectra, VMEQLGYPNPYR | 0.653 | 0.347 | 0.000 | 0.000 | 0.000 | 0.000 | 0.000 | 0.000 | ||
| 2 spectra, LVWQSK | 0.706 | 0.200 | 0.000 | 0.000 | 0.000 | 0.093 | 0.000 | 0.000 | ||
| 17 spectra, YVHPLTEEAIEEMER | 0.529 | 0.257 | 0.000 | 0.000 | 0.000 | 0.214 | 0.000 | 0.000 | ||
| 1 spectrum, SEVVILFSAHSLPMSVVNR | 0.569 | 0.266 | 0.166 | 0.000 | 0.000 | 0.000 | 0.000 | 0.000 | ||
| 1 spectrum, TTKPQAQPER | 0.590 | 0.098 | 0.000 | 0.116 | 0.000 | 0.196 | 0.000 | 0.000 | ||
| 8 spectra, GDPYPQEVGATVHR | 0.332 | 0.040 | 0.190 | 0.157 | 0.000 | 0.282 | 0.000 | 0.000 | ||
| 1 spectrum, ALADLVHSHIQSNK | 0.512 | 0.155 | 0.000 | 0.332 | 0.000 | 0.000 | 0.000 | 0.000 | ||
| 2 spectra, WPTHPLLIQCFADHILK | 0.828 | 0.058 | 0.000 | 0.025 | 0.000 | 0.089 | 0.000 | 0.000 | ||
| 1 spectrum, YYLFGR | 0.603 | 0.169 | 0.000 | 0.000 | 0.000 | 0.228 | 0.000 | 0.000 | ||
| 1 spectrum, VGPVPWLGPQTDEAIK | 0.607 | 0.332 | 0.000 | 0.000 | 0.000 | 0.060 | 0.000 | 0.000 |
| Plot | Mito | Lyso or Perox | ER | Golgi | PM | Cytosol | Nucleus | ||||||
| Expt B |
12 peptides |
30 spectra |
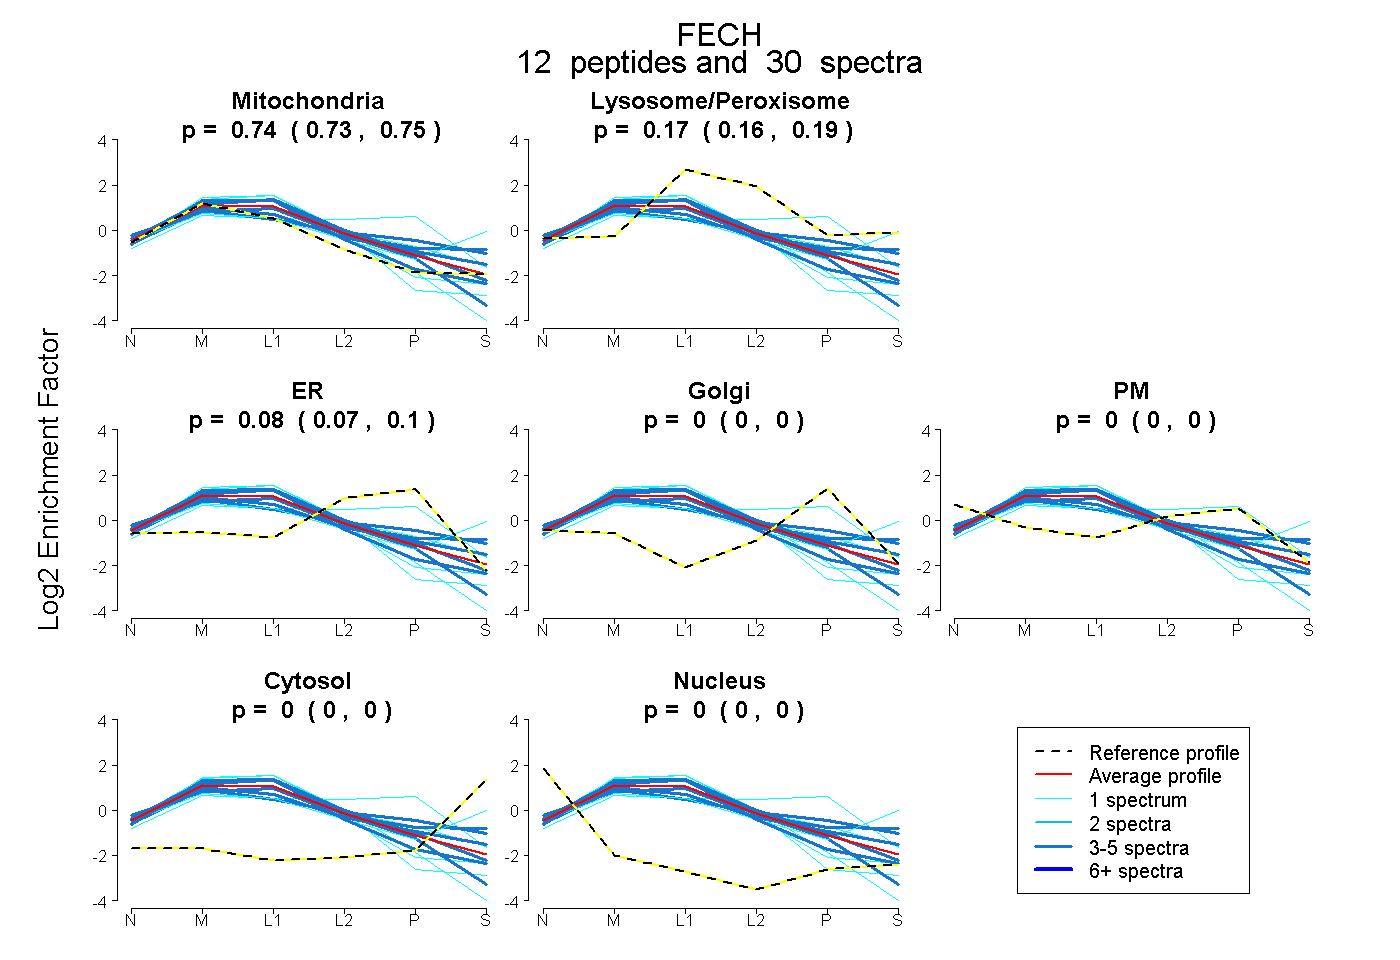 |
0.745 0.732 | 0.755 |
0.173 0.156 | 0.186 |
0.082 0.066 | 0.096 |
0.000 0.000 | 0.000 |
0.000 0.000 | 0.000 |
0.000 0.000 | 0.000 |
0.000 0.000 | 0.000 |
|||
| Plot | Lyso | Other | |||||||||||
| Expt C |
20 peptides |
340 spectra |
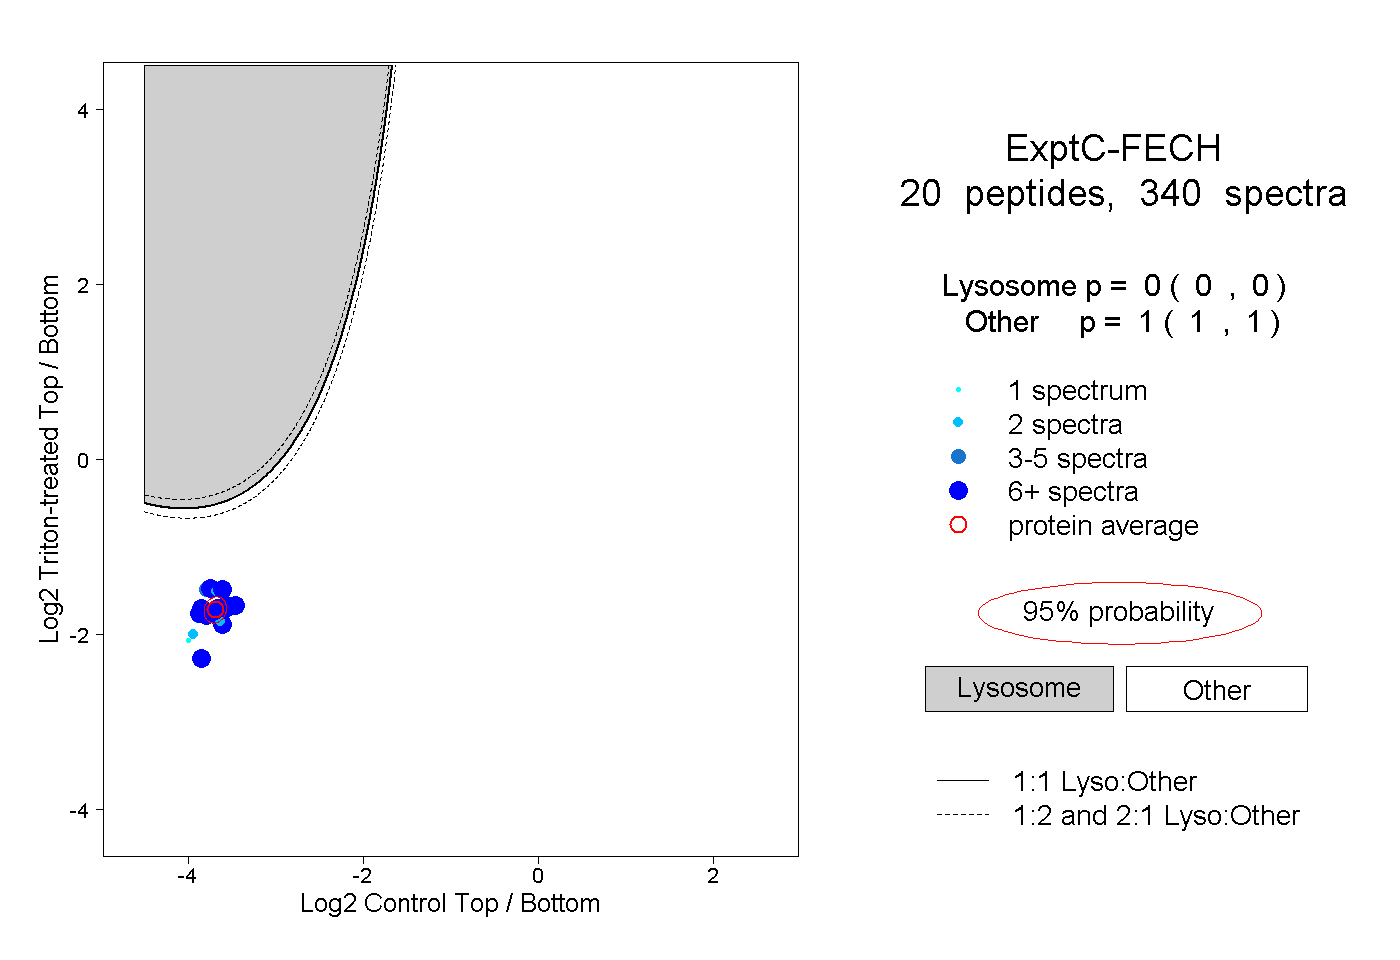 |
0.000 0.000 | 0.000 |
1.000 1.000 | 1.000 |
||||||||
| Plot | Lyso | Other | |||||||||||
| Expt D |
13 peptides |
21 spectra |
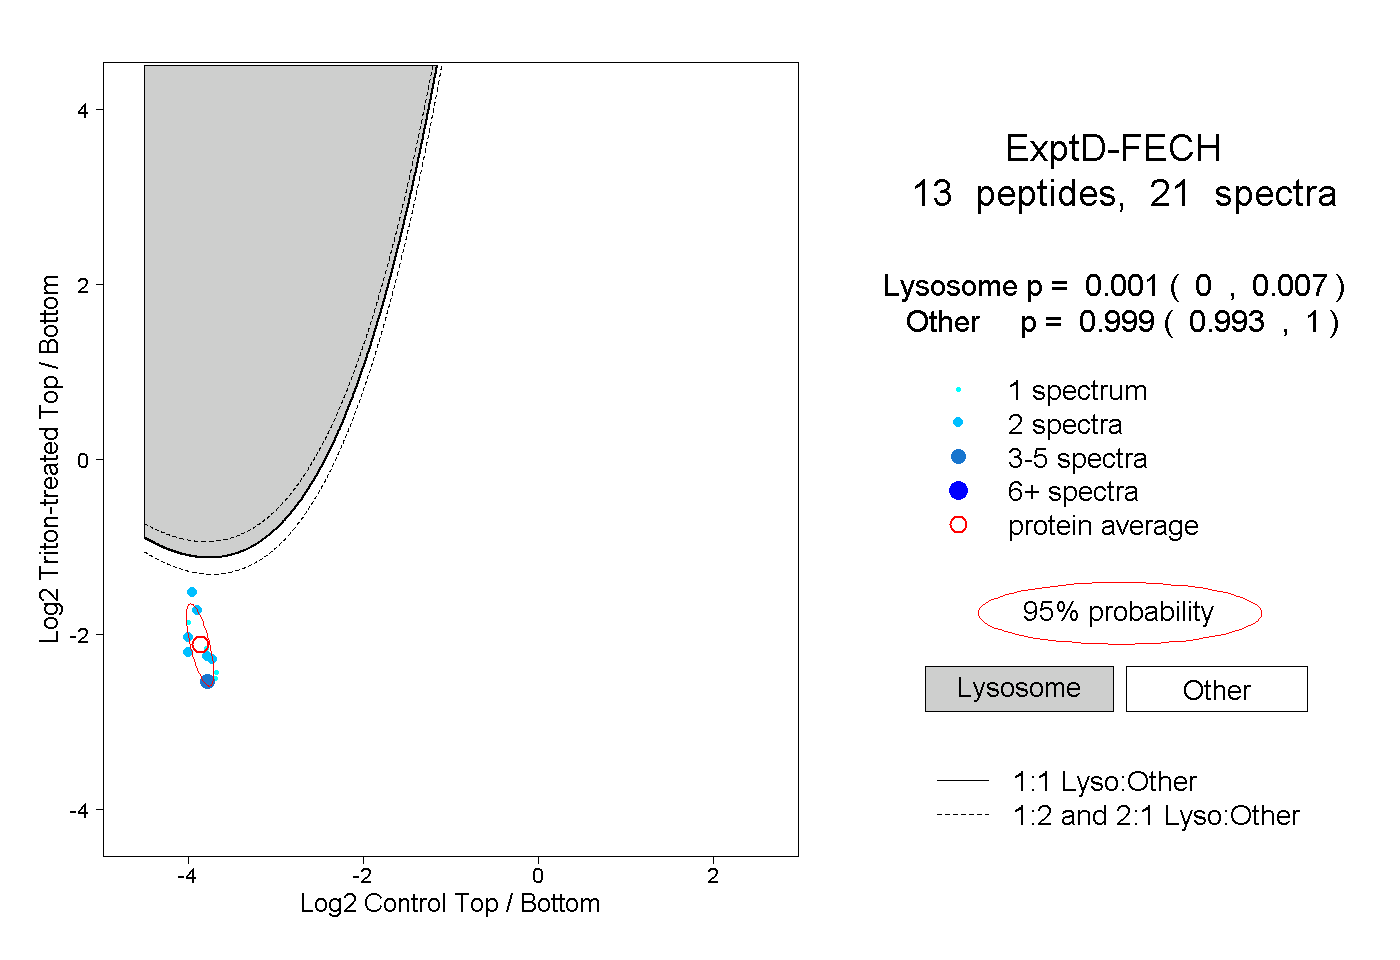 |
0.001 0.000 | 0.007 |
0.999 0.993 | 1.000 |