 7
7peptides
spectra
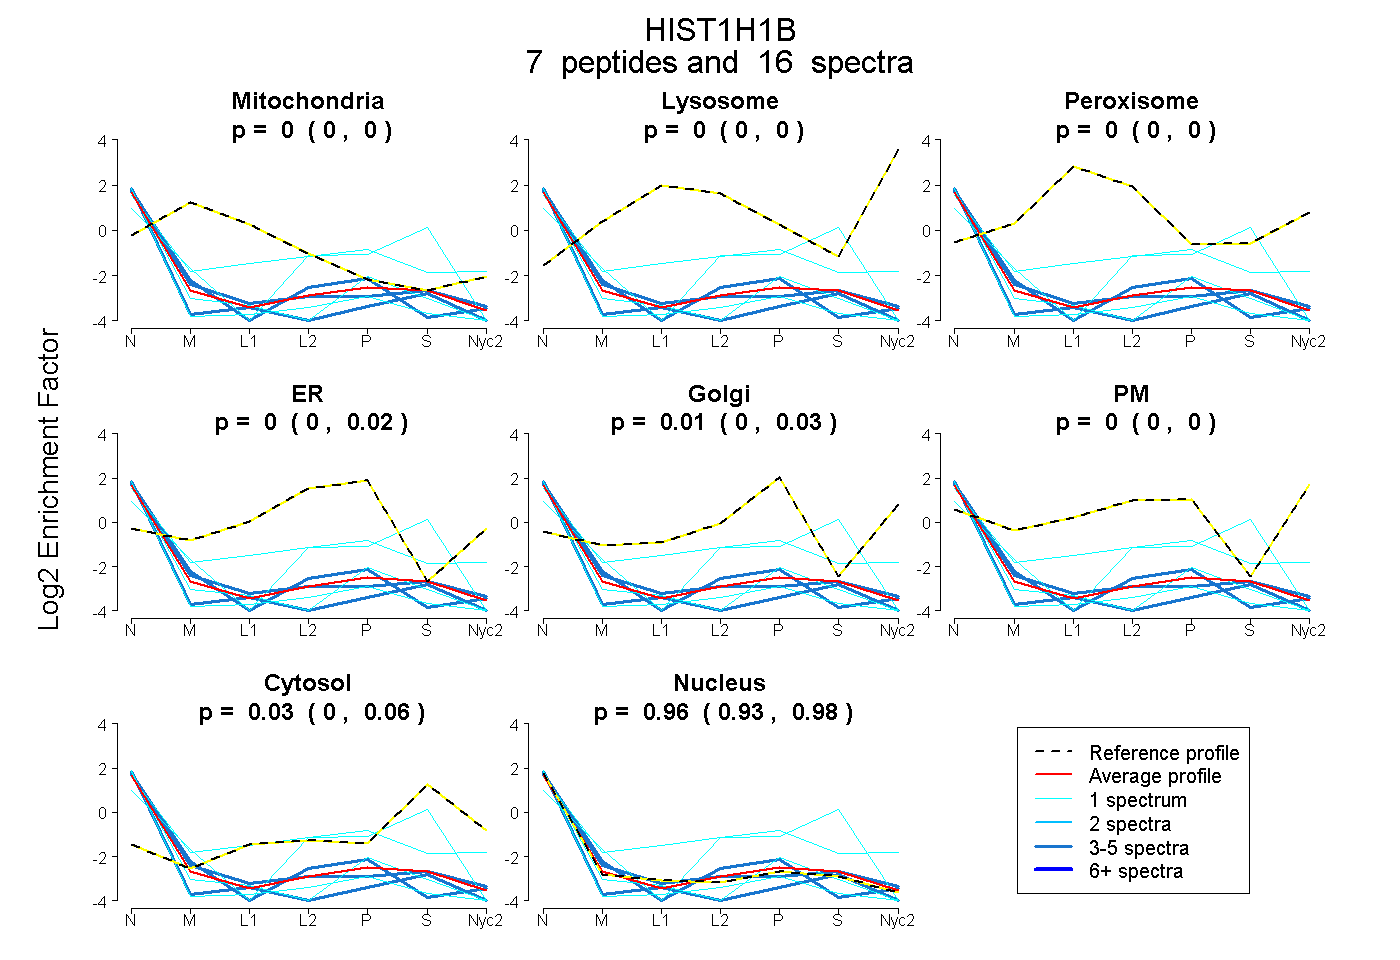
0.000 | 0.000
0.000 | 0.000
0.000 | 0.000
0.000 | 0.019
0.000 | 0.031
0.000 | 0.000
0.000 | 0.057
0.934 | 0.979
| Plot | Mito | Lyso | Perox | ER | Golgi | PM | Cytosol | Nucleus | |||||
| Expt A |
7 peptides |
16 spectra |
|
0.000 0.000 | 0.000 |
0.000 0.000 | 0.000 |
0.000 0.000 | 0.000 |
0.000 0.000 | 0.019 |
0.011 0.000 | 0.031 |
0.000 0.000 | 0.000 |
0.029 0.000 | 0.057 |
0.960 0.934 | 0.979 |
| 4 spectra, GGVSLPALK | 0.000 | 0.000 | 0.000 | 0.040 | 0.018 | 0.000 | 0.000 | 0.943 | ||
| 1 spectrum, KPTGATPK | 0.000 | 0.000 | 0.000 | 0.000 | 0.000 | 0.000 | 0.000 | 1.000 | ||
| 1 spectrum, SPARPK | 0.000 | 0.000 | 0.000 | 0.000 | 0.000 | 0.000 | 0.000 | 1.000 | ||
| 1 spectrum, KPAAAGVK | 0.000 | 0.000 | 0.000 | 0.029 | 0.000 | 0.000 | 0.404 | 0.566 | ||
| 3 spectra, ALAAGGYDVEK | 0.000 | 0.000 | 0.000 | 0.000 | 0.000 | 0.000 | 0.000 | 1.000 | ||
| 5 spectra, AVSASK | 0.044 | 0.000 | 0.000 | 0.000 | 0.000 | 0.000 | 0.020 | 0.935 | ||
| 1 spectrum, VASGEAKPK | 0.000 | 0.000 | 0.077 | 0.112 | 0.000 | 0.209 | 0.064 | 0.538 |
| Plot | Lyso | Other | |||||||||||
| Expt C |
1 peptide |
4 spectra |
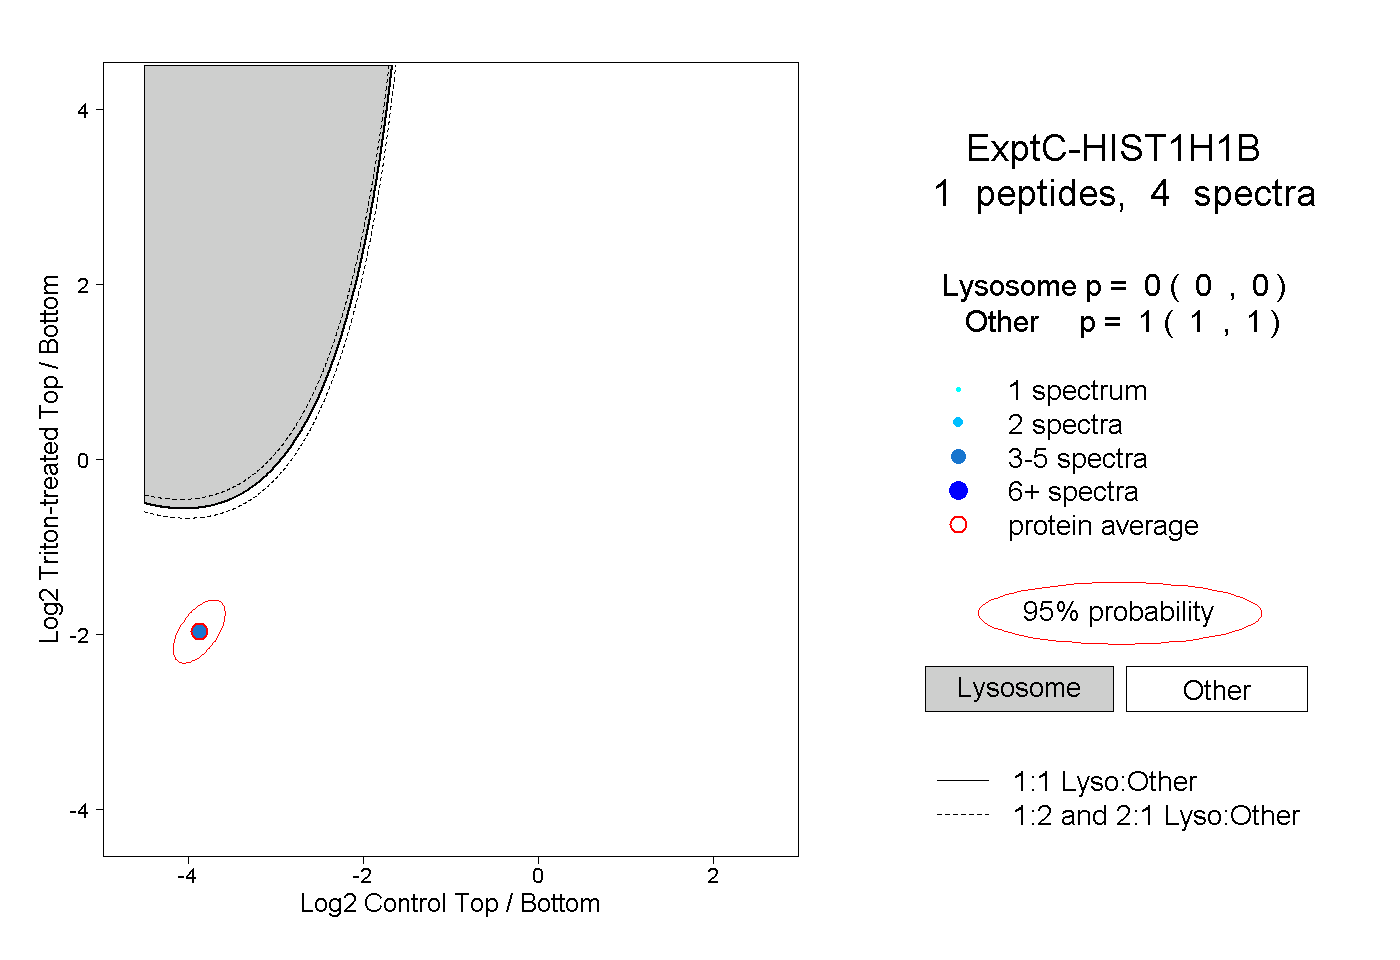 |
0.000 0.000 | 0.000 |
1.000 1.000 | 1.000 |