 26
26peptides
spectra
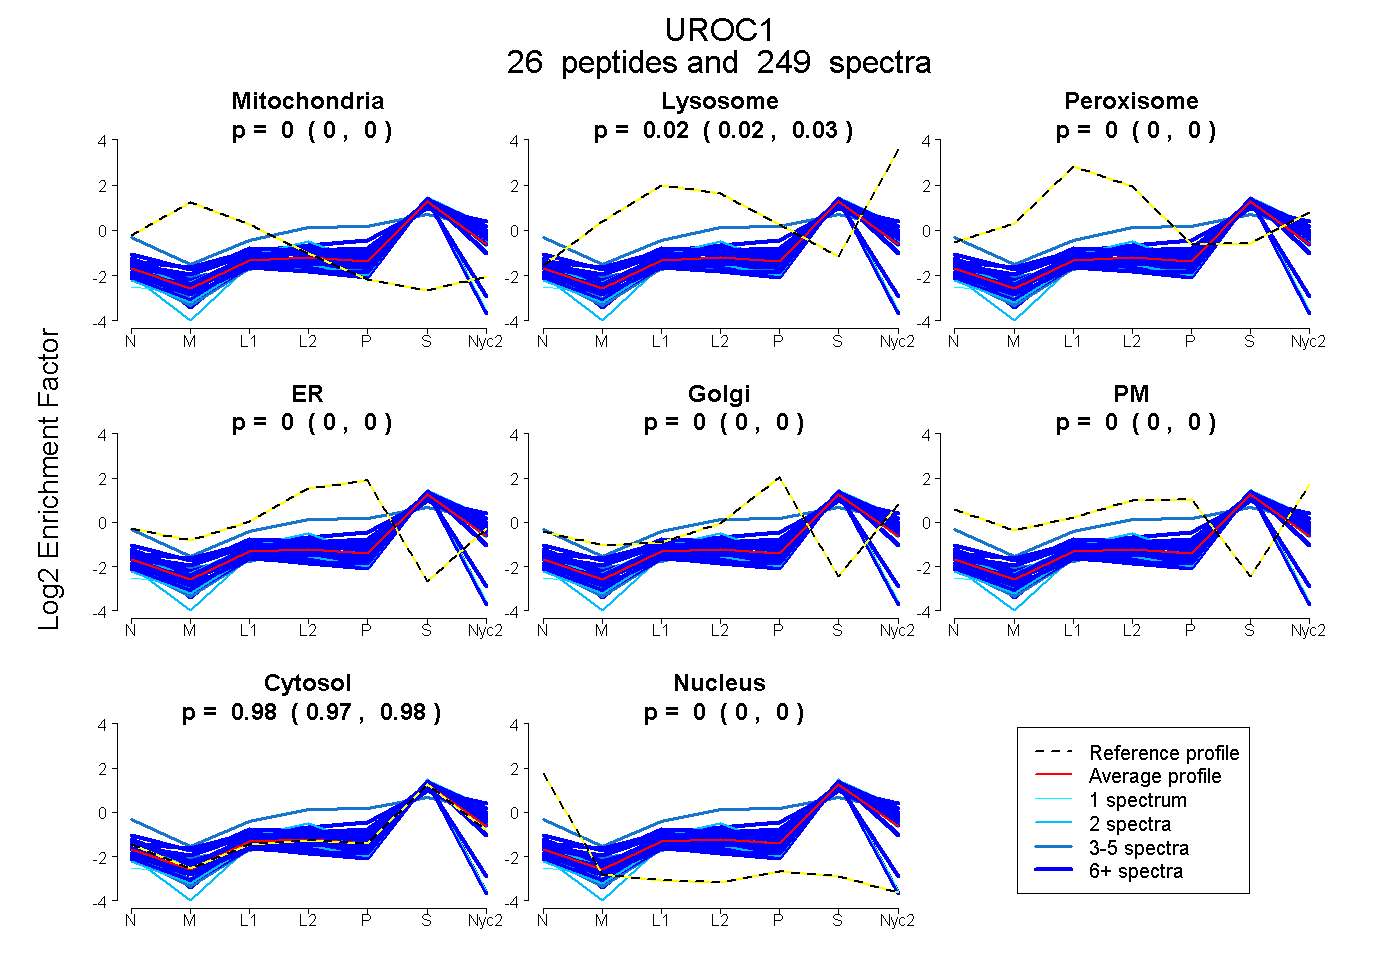
0.000 | 0.000
0.021 | 0.026
0.000 | 0.000
0.000 | 0.000
0.000 | 0.000
0.000 | 0.000
0.974 | 0.978
0.000 | 0.000
19peptides
spectra
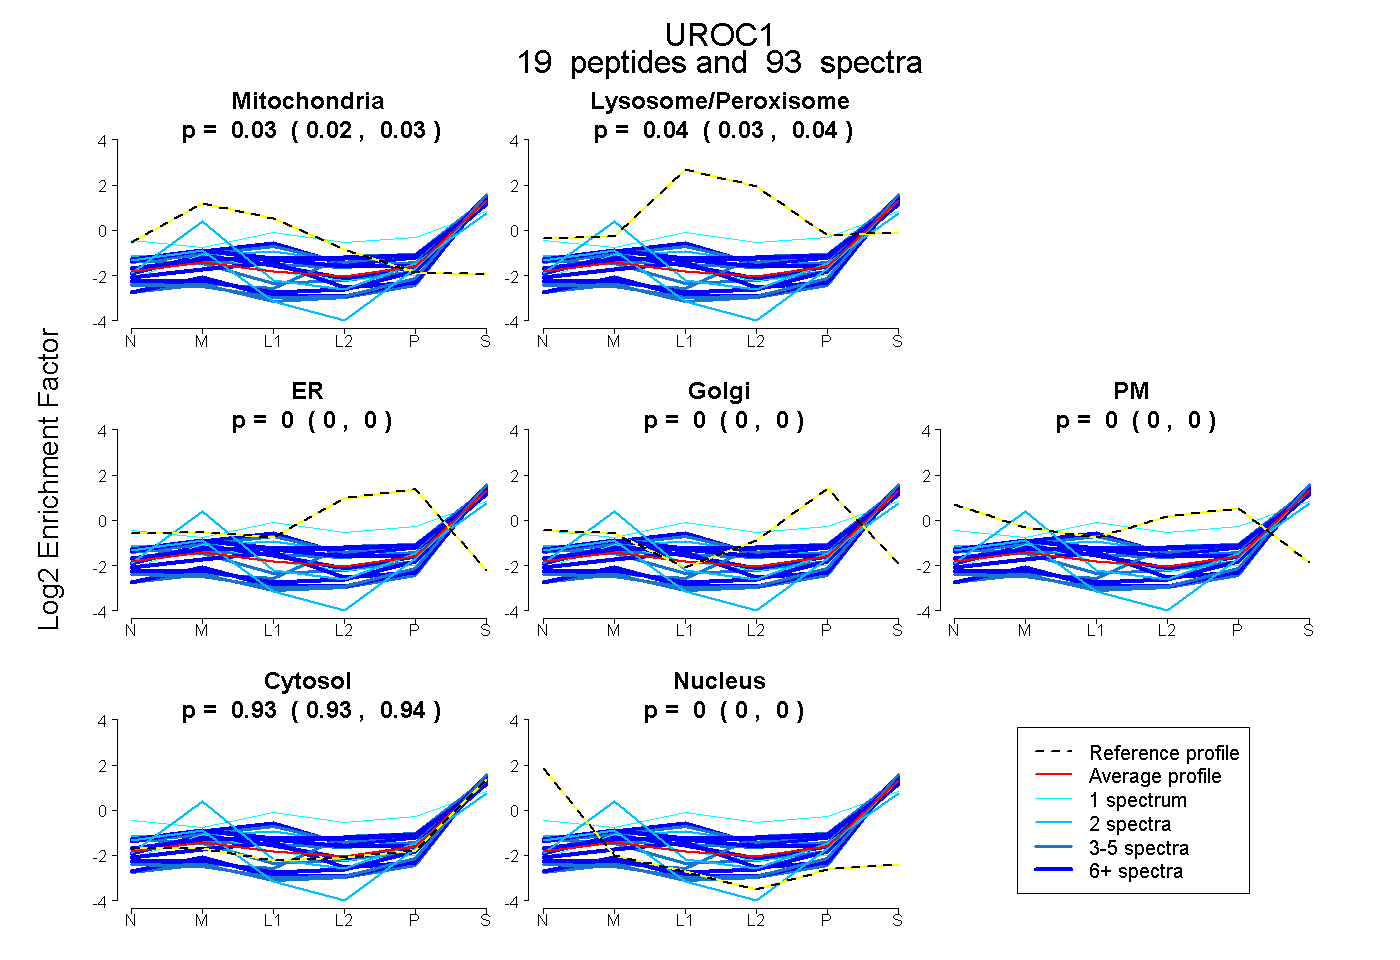
0.022 | 0.034
0.030 | 0.044
0.000 | 0.000
0.000 | 0.000
0.000 | 0.000
0.929 | 0.939
0.000 | 0.000
21peptides
spectra
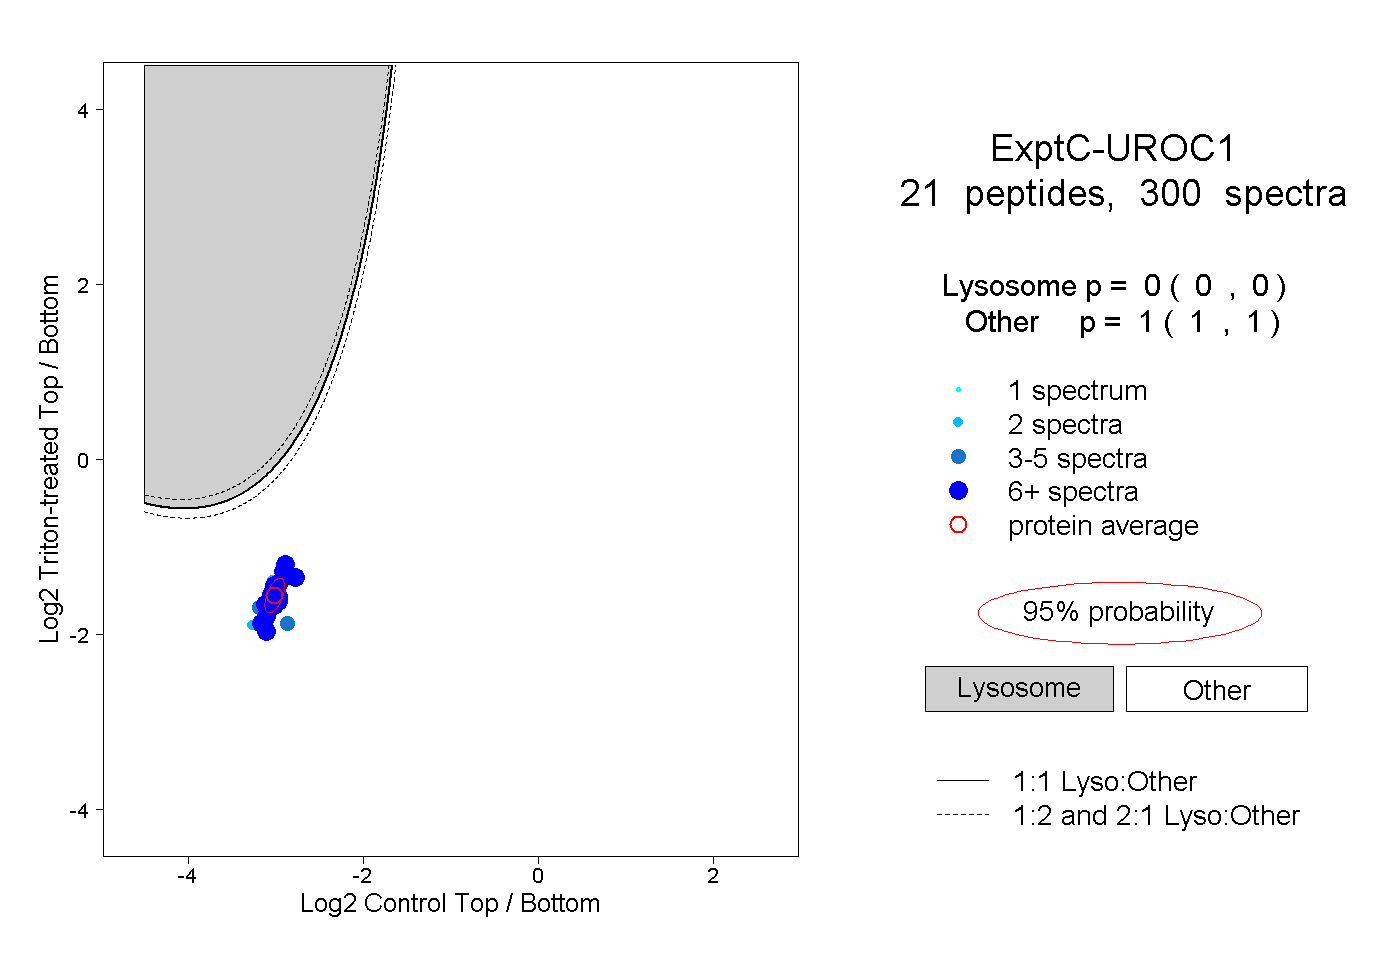
0.000 | 0.000
1.000 | 1.000
12peptides
spectra
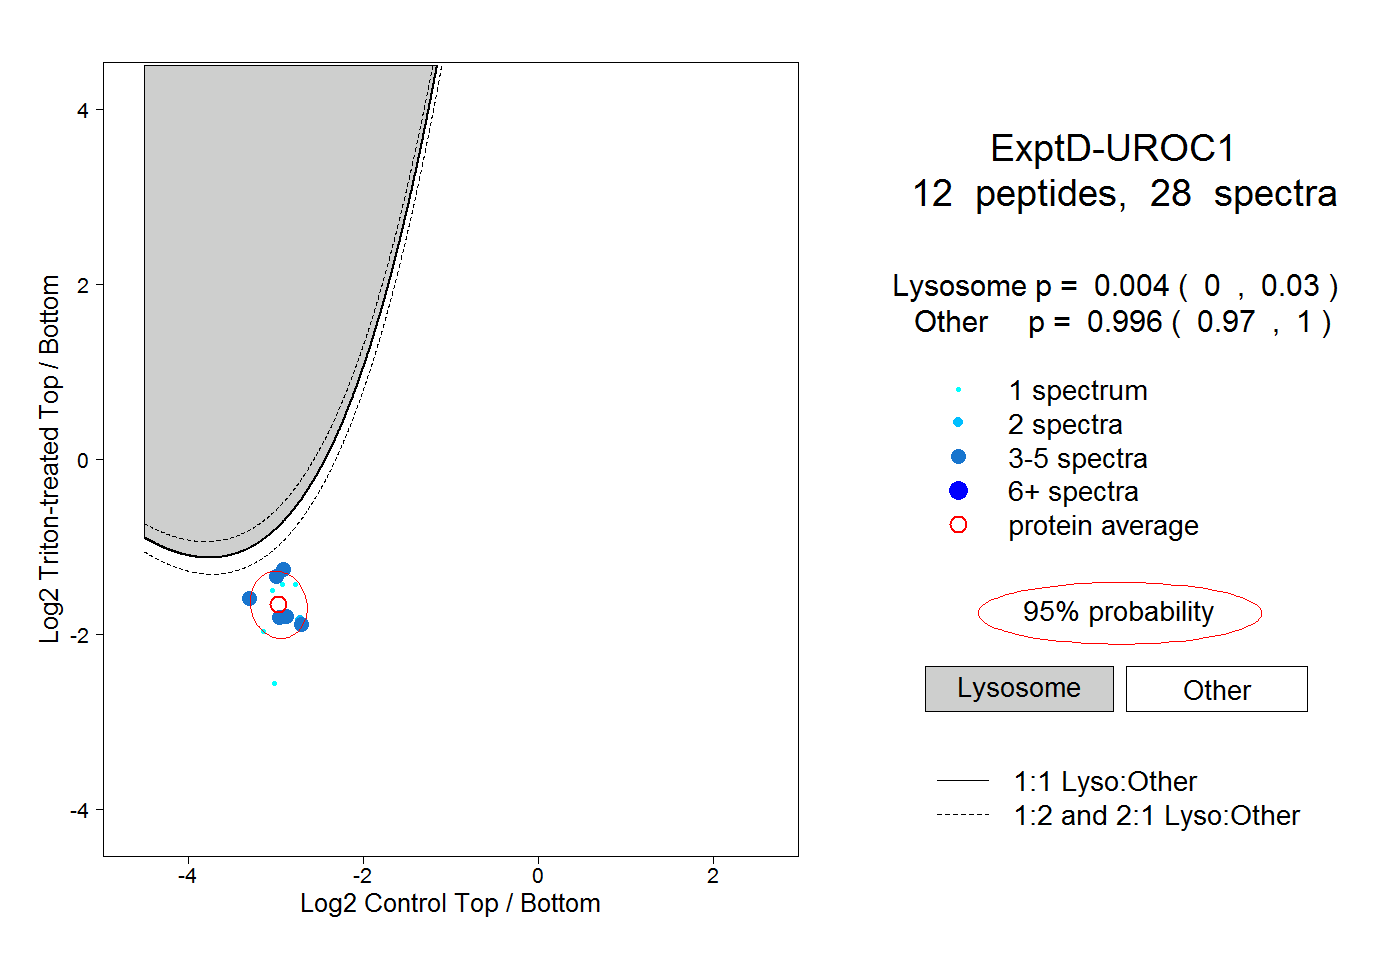
0.000 | 0.030
0.970 | 1.000