 3
3peptides
spectra
0.000 | 0.000
0.088 | 0.375
0.000 | 0.153
0.000 | 0.132
0.081 | 0.387
0.000 | 0.317
0.227 | 0.329
0.000 | 0.000
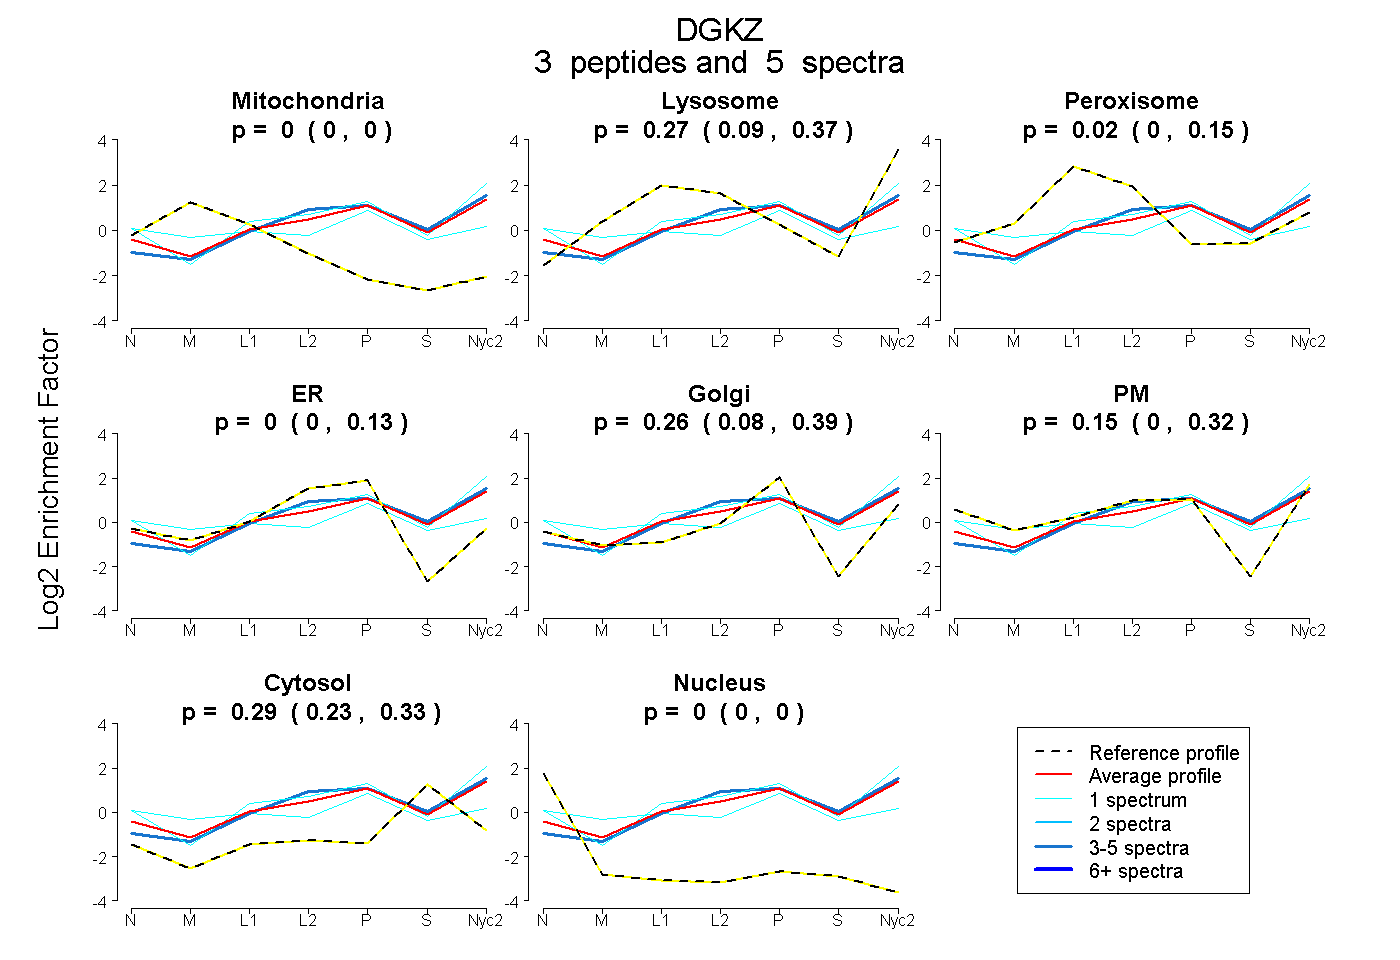
| Plot | Mito | Lyso | Perox | ER | Golgi | PM | Cytosol | Nucleus | |||||
| Expt A |
3 peptides |
5 spectra |
|
0.000 0.000 | 0.000 |
0.273 0.088 | 0.375 |
0.024 0.000 | 0.153 |
0.000 0.000 | 0.132 |
0.262 0.081 | 0.387 |
0.153 0.000 | 0.317 |
0.288 0.227 | 0.329 |
0.000 0.000 | 0.000 |
| 1 spectrum, LKPPPPVAILPLGTGNDLAR | 0.000 | 0.278 | 0.000 | 0.000 | 0.081 | 0.412 | 0.229 | 0.000 | ||
| 1 spectrum, AQDTELAAYLENR | 0.046 | 0.000 | 0.220 | 0.000 | 0.389 | 0.101 | 0.244 | 0.000 | ||
| 3 spectra, LFGHR | 0.000 | 0.392 | 0.000 | 0.100 | 0.209 | 0.000 | 0.299 | 0.000 |
| Plot | Lyso | Other | |||||||||||
| Expt C |
1 peptide |
1 spectrum |
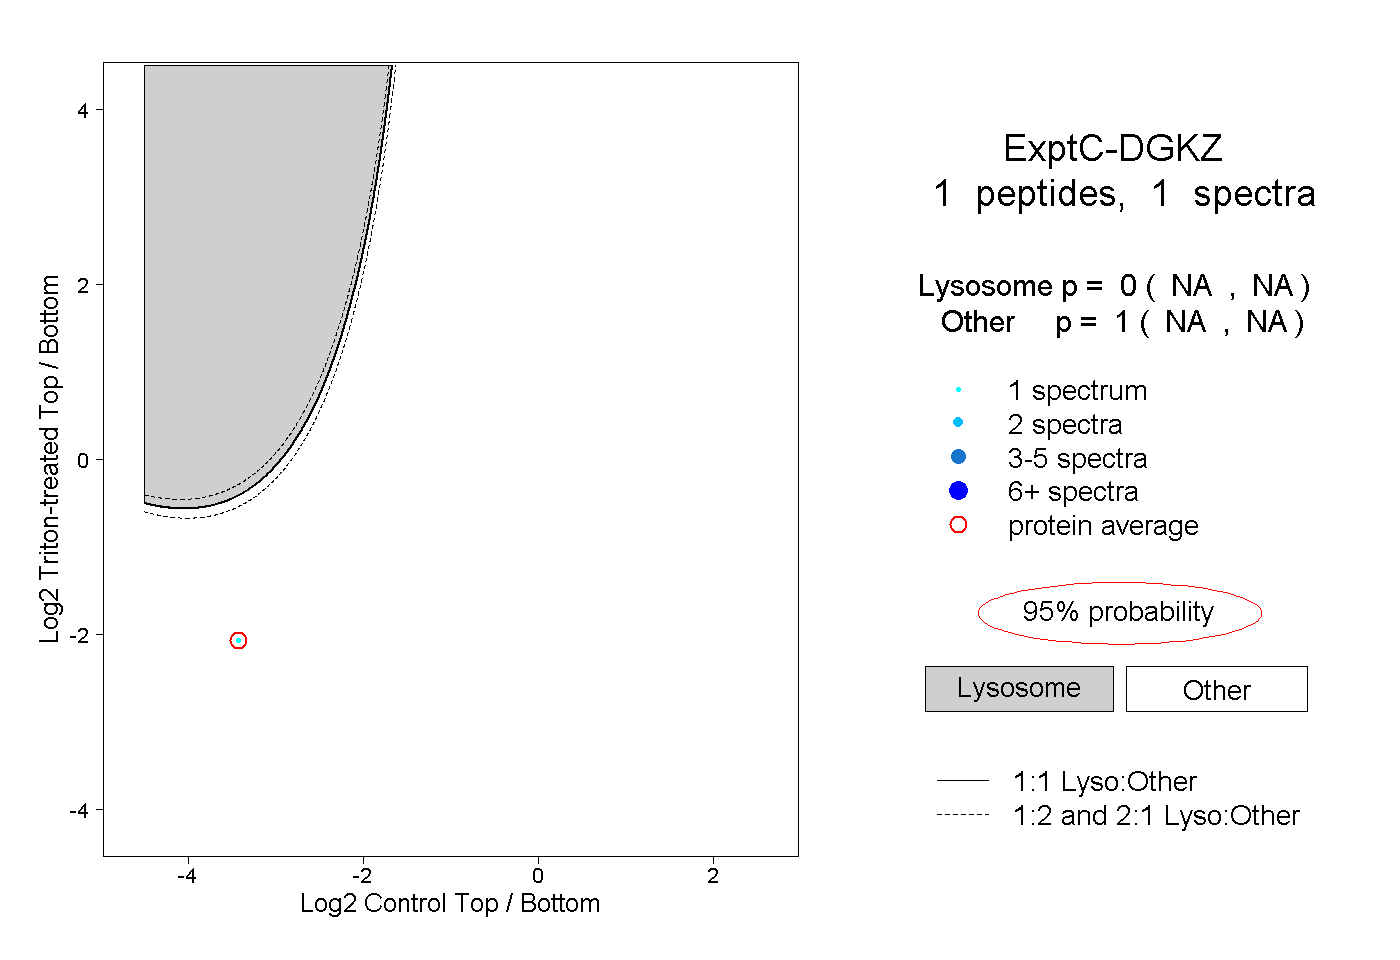 |
0.000 NA | NA |
1.000 NA | NA |