 4
4peptides
spectra
0.000 | 0.103
0.000 | 0.019
0.000 | 0.083
0.000 | 0.067
0.000 | 0.153
0.022 | 0.328
0.600 | 0.735
0.000 | 0.075
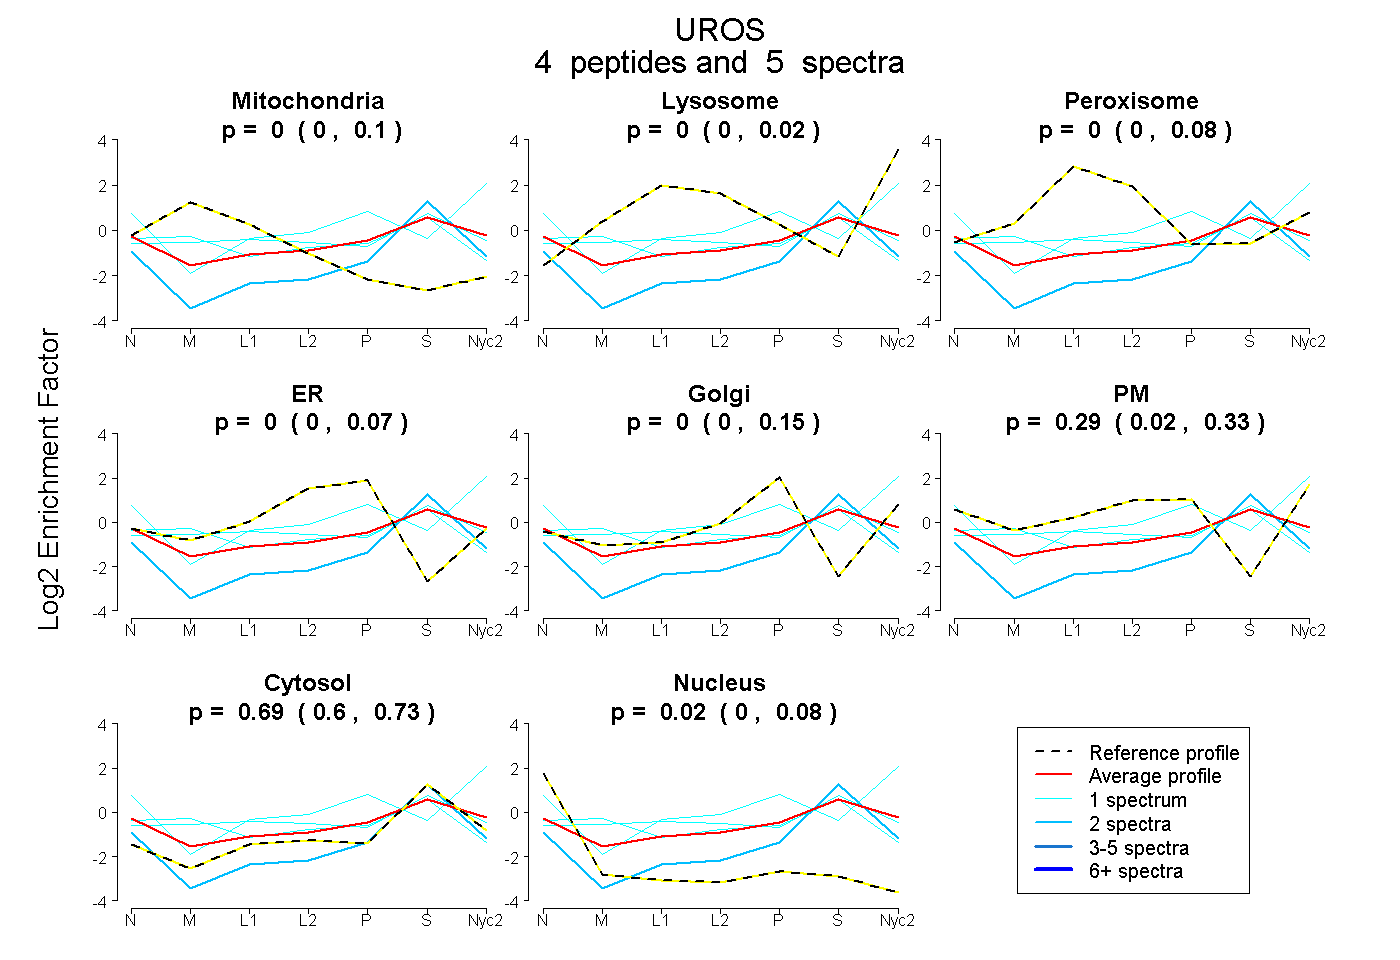
| Plot | Mito | Lyso | Perox | ER | Golgi | PM | Cytosol | Nucleus | |||||
| Expt A |
4 peptides |
5 spectra |
|
0.000 0.000 | 0.103 |
0.000 0.000 | 0.019 |
0.000 0.000 | 0.083 |
0.000 0.000 | 0.067 |
0.000 0.000 | 0.153 |
0.286 0.022 | 0.328 |
0.693 0.600 | 0.735 |
0.021 0.000 | 0.075 |
| 1 spectrum, LSHPEGFGGLIFTSPR | 0.274 | 0.000 | 0.010 | 0.126 | 0.004 | 0.000 | 0.586 | 0.000 | ||
| 1 spectrum, SVYVVGSATASLVNK | 0.115 | 0.000 | 0.222 | 0.000 | 0.014 | 0.069 | 0.581 | 0.000 | ||
| 2 spectra, FVAIGPSTTR | 0.000 | 0.000 | 0.000 | 0.000 | 0.000 | 0.000 | 0.864 | 0.136 | ||
| 1 spectrum, VLLLK | 0.000 | 0.023 | 0.000 | 0.000 | 0.000 | 0.657 | 0.320 | 0.000 |