 2
2peptides
spectra
0.000 | 0.000
0.246 | 0.376
0.000 | 0.000
0.000 | 0.000
0.000 | 0.000
0.016 | 0.134
0.549 | 0.642
0.000 | 0.000
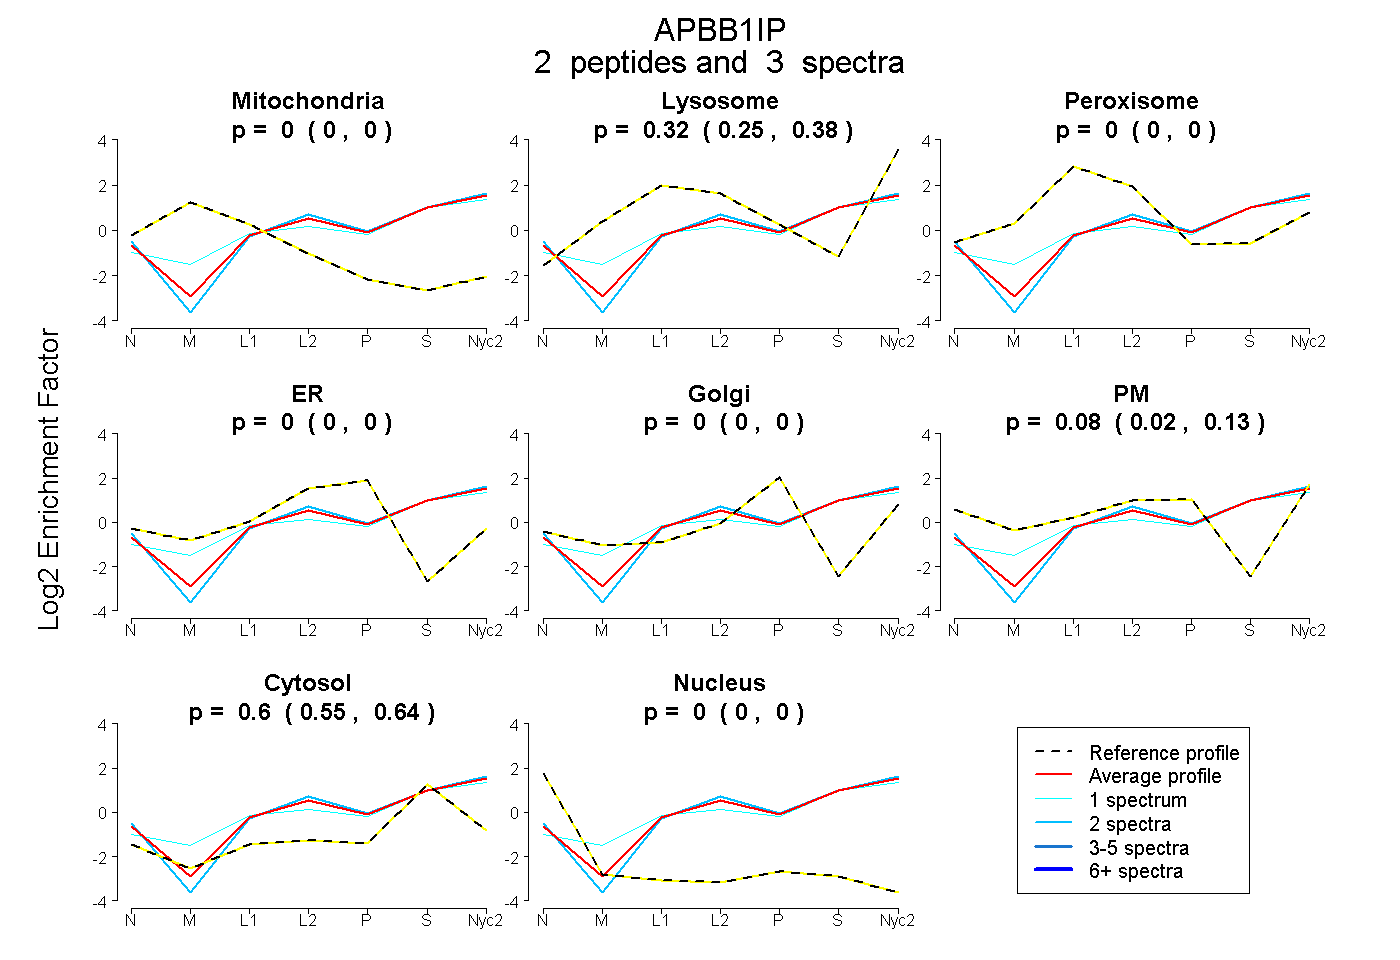
| Plot | Mito | Lyso | Perox | ER | Golgi | PM | Cytosol | Nucleus | |||||
| Expt A |
2 peptides |
3 spectra |
|
0.000 0.000 | 0.000 |
0.317 0.246 | 0.376 |
0.000 0.000 | 0.000 |
0.000 0.000 | 0.000 |
0.000 0.000 | 0.000 |
0.082 0.016 | 0.134 |
0.601 0.549 | 0.642 |
0.000 0.000 | 0.000 |
| 1 spectrum, IFEDHENVVEVLSDWTR | 0.000 | 0.417 | 0.000 | 0.000 | 0.000 | 0.006 | 0.577 | 0.000 | ||
| 2 spectra, EEEEALAK | 0.000 | 0.267 | 0.000 | 0.000 | 0.000 | 0.120 | 0.613 | 0.000 |
| Plot | Mito | Lyso or Perox | ER | Golgi | PM | Cytosol | Nucleus | ||||||
| Expt B |
2 peptides |
2 spectra |
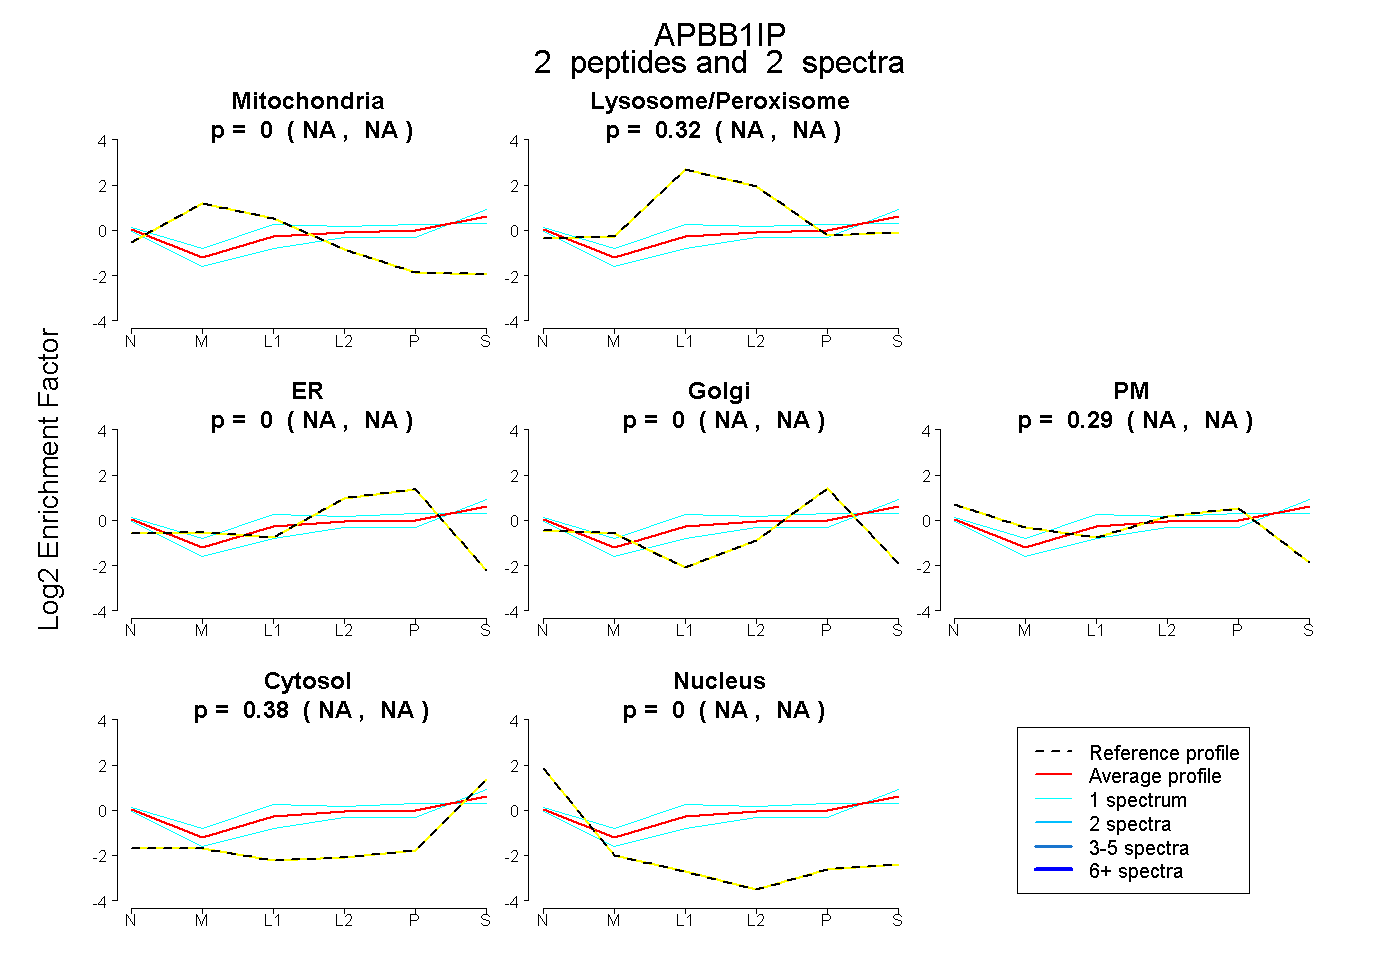 |
0.000 NA | NA |
0.324 NA | NA |
0.000 NA | NA |
0.000 NA | NA |
0.294 NA | NA |
0.381 NA | NA |
0.000 NA | NA |
|||
| Plot | Lyso | Other | |||||||||||
| Expt C |
2 peptides |
4 spectra |
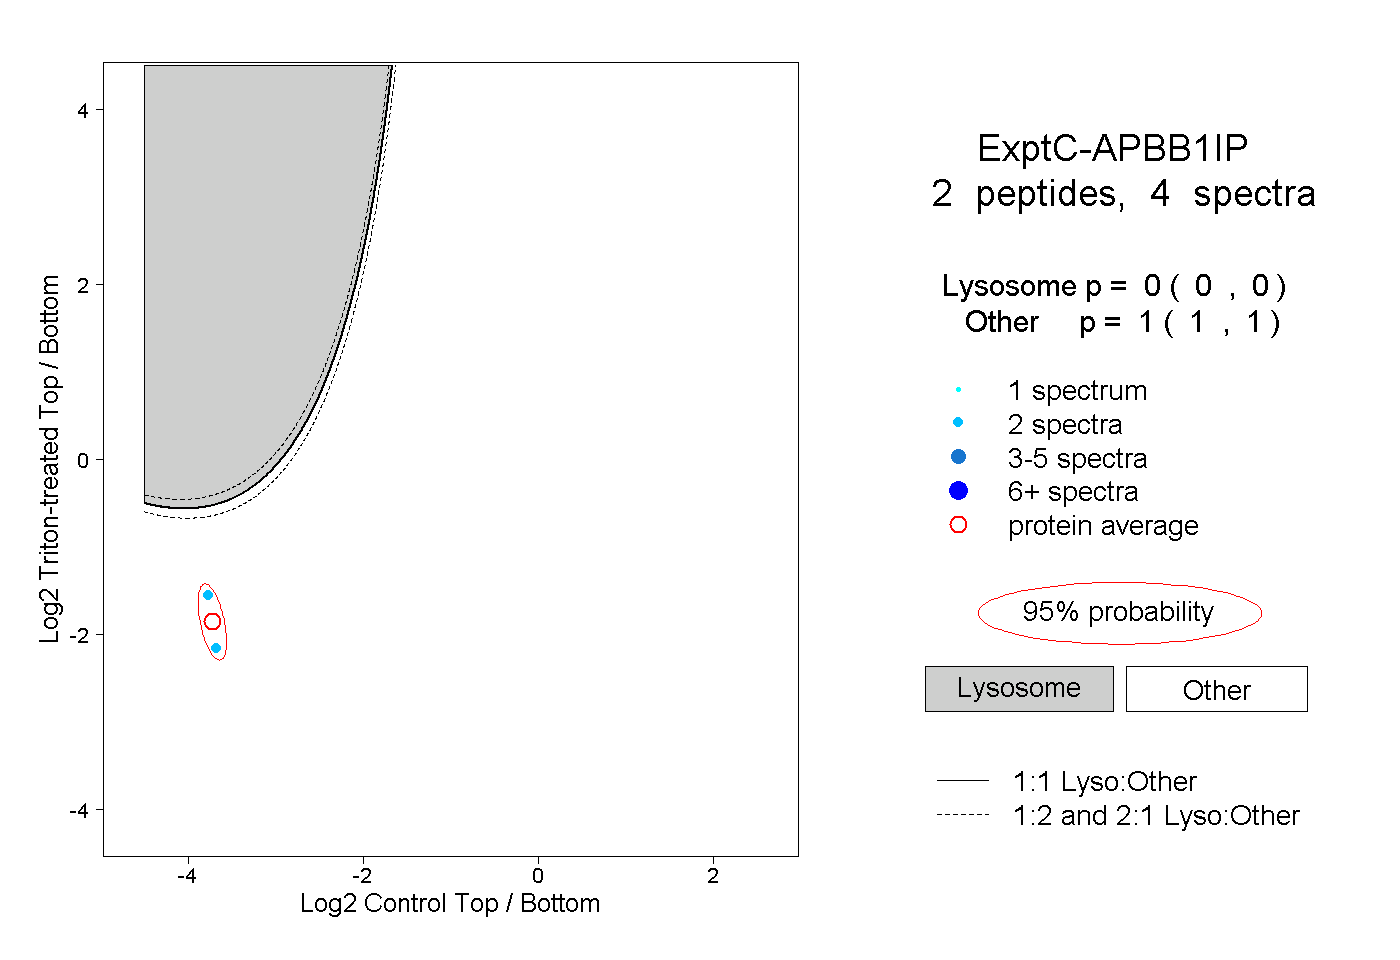 |
0.000 0.000 | 0.000 |
1.000 1.000 | 1.000 |