 2
2peptides
spectra
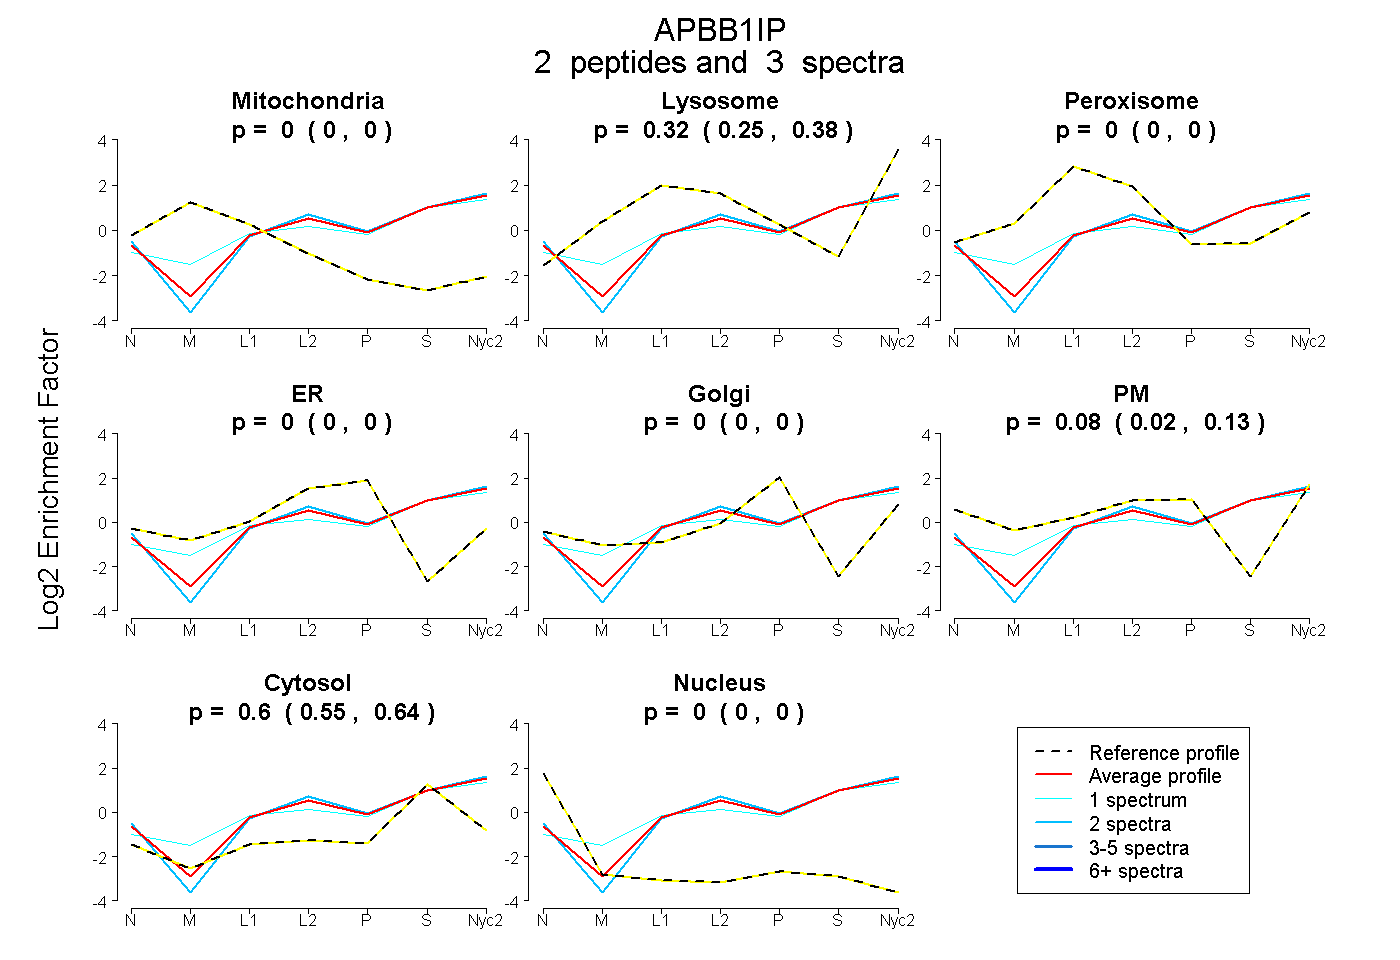
0.000 | 0.000
0.246 | 0.376
0.000 | 0.000
0.000 | 0.000
0.000 | 0.000
0.016 | 0.134
0.549 | 0.642
0.000 | 0.000
2peptides
spectra
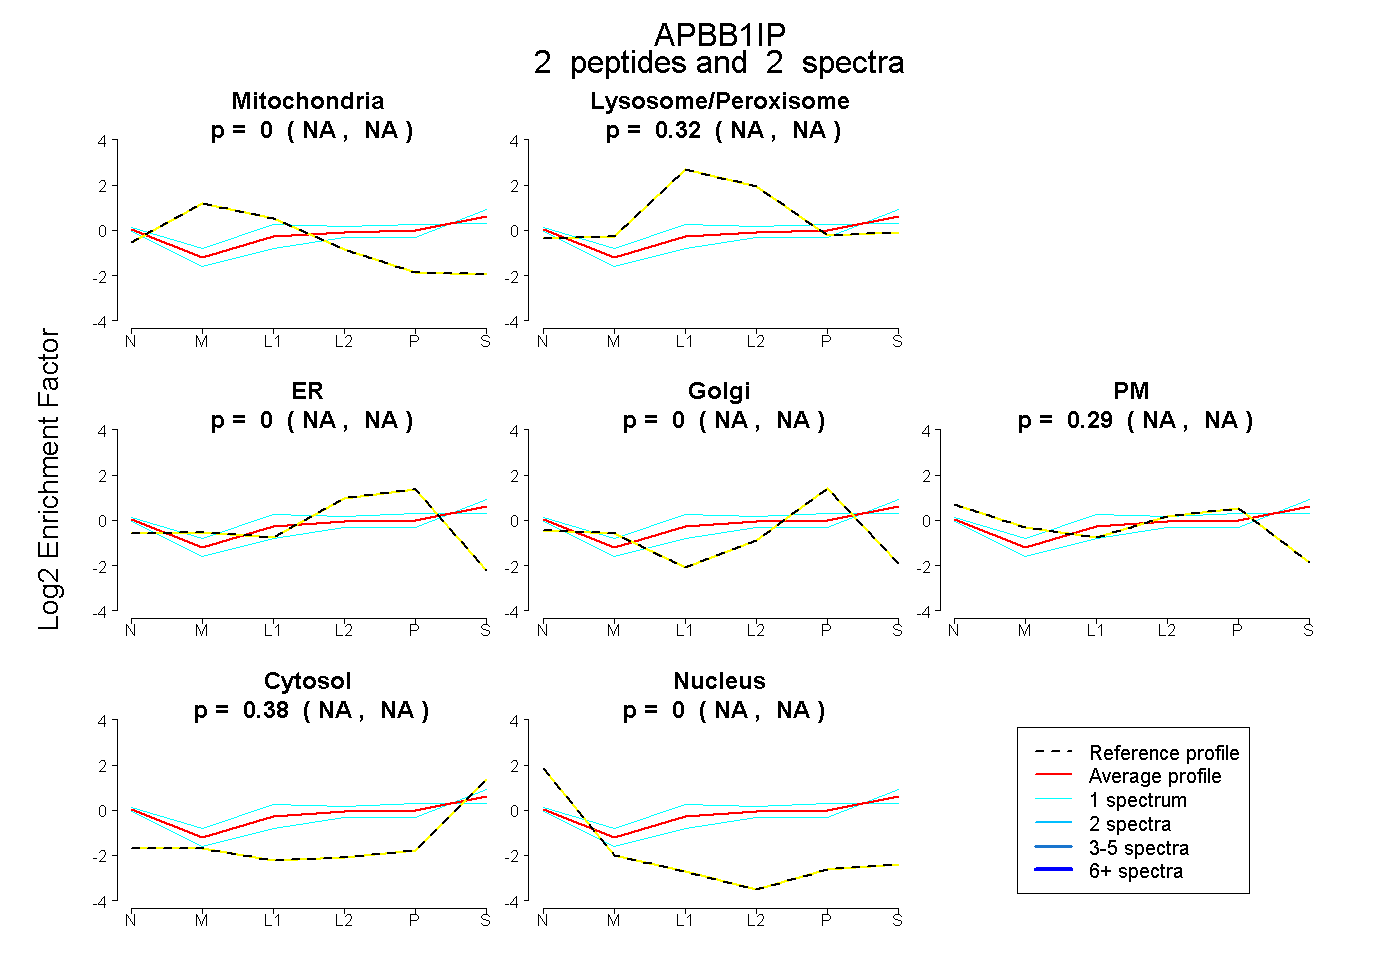
NA | NA
NA | NA
NA | NA
NA | NA
NA | NA
NA | NA
NA | NA
2peptides
spectra
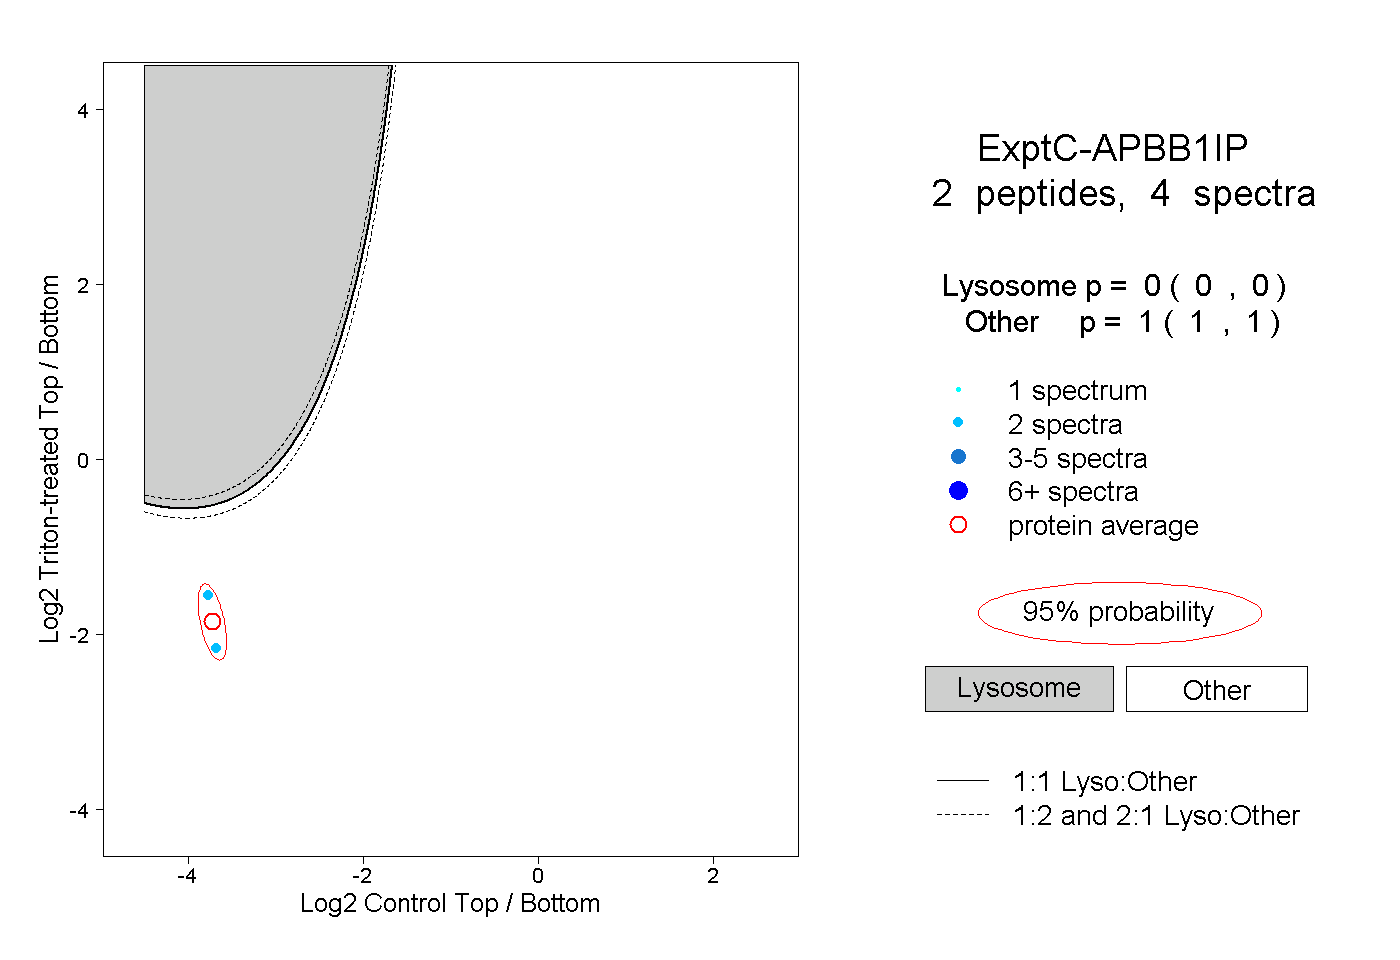
0.000 | 0.000
1.000 | 1.000