 3
3peptides
spectra
0.000 | 0.005
0.000 | 0.000
0.000 | 0.274
0.000 | 0.275
0.000 | 0.225
0.000 | 0.396
0.369 | 0.551
0.019 | 0.173
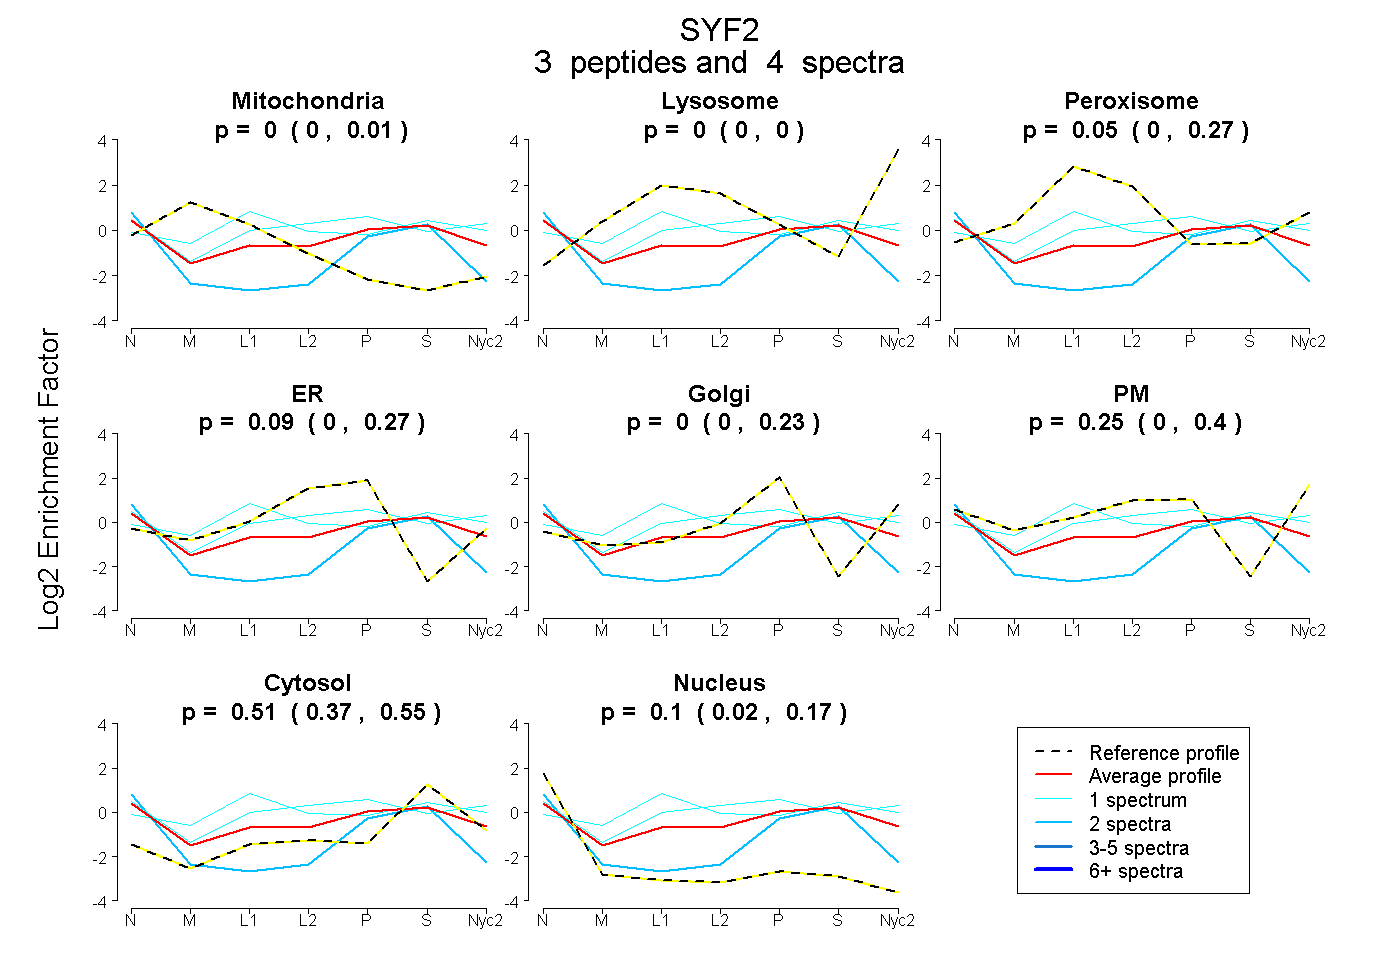
| Plot | Mito | Lyso | Perox | ER | Golgi | PM | Cytosol | Nucleus | |||||
| Expt A |
3 peptides |
4 spectra |
|
0.000 0.000 | 0.005 |
0.000 0.000 | 0.000 |
0.053 0.000 | 0.274 |
0.086 0.000 | 0.275 |
0.000 0.000 | 0.225 |
0.253 0.000 | 0.396 |
0.511 0.369 | 0.551 |
0.097 0.019 | 0.173 |
| 2 spectra, LEWELQEEEK | 0.000 | 0.000 | 0.000 | 0.000 | 0.101 | 0.000 | 0.498 | 0.401 | ||
| 1 spectrum, LLEISAEDAER | 0.000 | 0.000 | 0.102 | 0.074 | 0.000 | 0.433 | 0.390 | 0.000 | ||
| 1 spectrum, MVLDLEK | 0.000 | 0.000 | 0.464 | 0.000 | 0.062 | 0.075 | 0.386 | 0.014 |