 5
5peptides
spectra
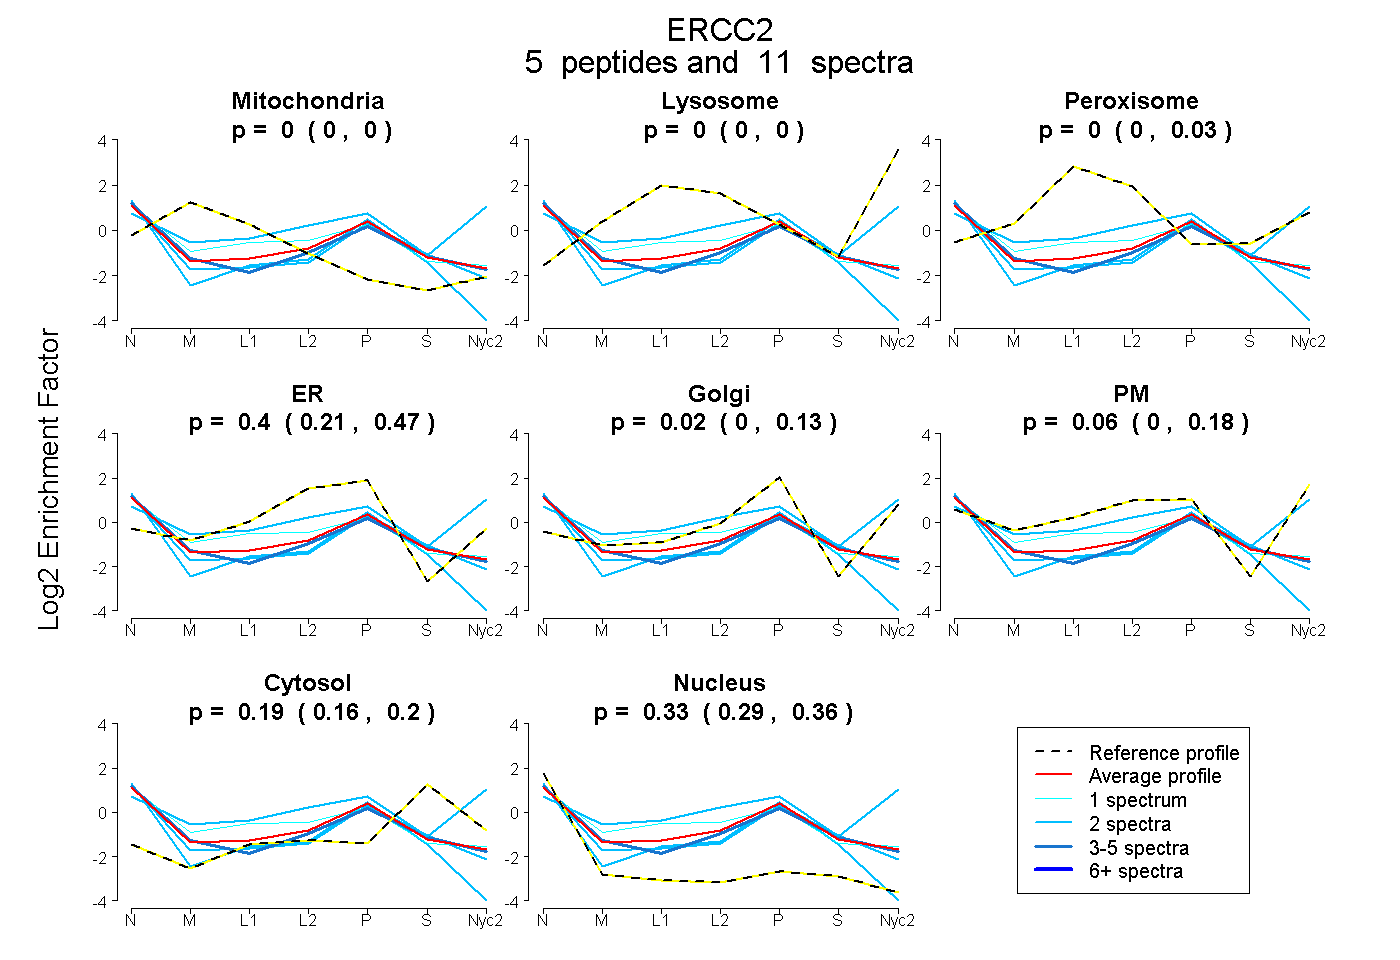
0.000 | 0.000
0.000 | 0.000
0.000 | 0.028
0.211 | 0.473
0.000 | 0.127
0.000 | 0.176
0.158 | 0.196
0.295 | 0.359
| Plot | Mito | Lyso | Perox | ER | Golgi | PM | Cytosol | Nucleus | |||||
| Expt A |
5 peptides |
11 spectra |
|
0.000 0.000 | 0.000 |
0.000 0.000 | 0.000 |
0.000 0.000 | 0.028 |
0.397 0.211 | 0.473 |
0.025 0.000 | 0.127 |
0.062 0.000 | 0.176 |
0.186 0.158 | 0.196 |
0.330 0.295 | 0.359 |
| 2 spectra, VQHVVQESPPAFLSGLAQR | 0.000 | 0.000 | 0.000 | 0.000 | 0.000 | 0.762 | 0.226 | 0.012 | ||
| 2 spectra, FYEEFDTHGR | 0.000 | 0.000 | 0.000 | 0.254 | 0.136 | 0.000 | 0.204 | 0.406 | ||
| 2 spectra, GAILLSVAR | 0.000 | 0.000 | 0.000 | 0.357 | 0.000 | 0.000 | 0.073 | 0.570 | ||
| 4 spectra, TAEHFLGFLR | 0.000 | 0.000 | 0.000 | 0.274 | 0.128 | 0.042 | 0.182 | 0.374 | ||
| 1 spectrum, NLCIHPEVTPLR | 0.000 | 0.000 | 0.211 | 0.355 | 0.041 | 0.000 | 0.043 | 0.351 |
| Plot | Lyso | Other | |||||||||||
| Expt C |
1 peptide |
1 spectrum |
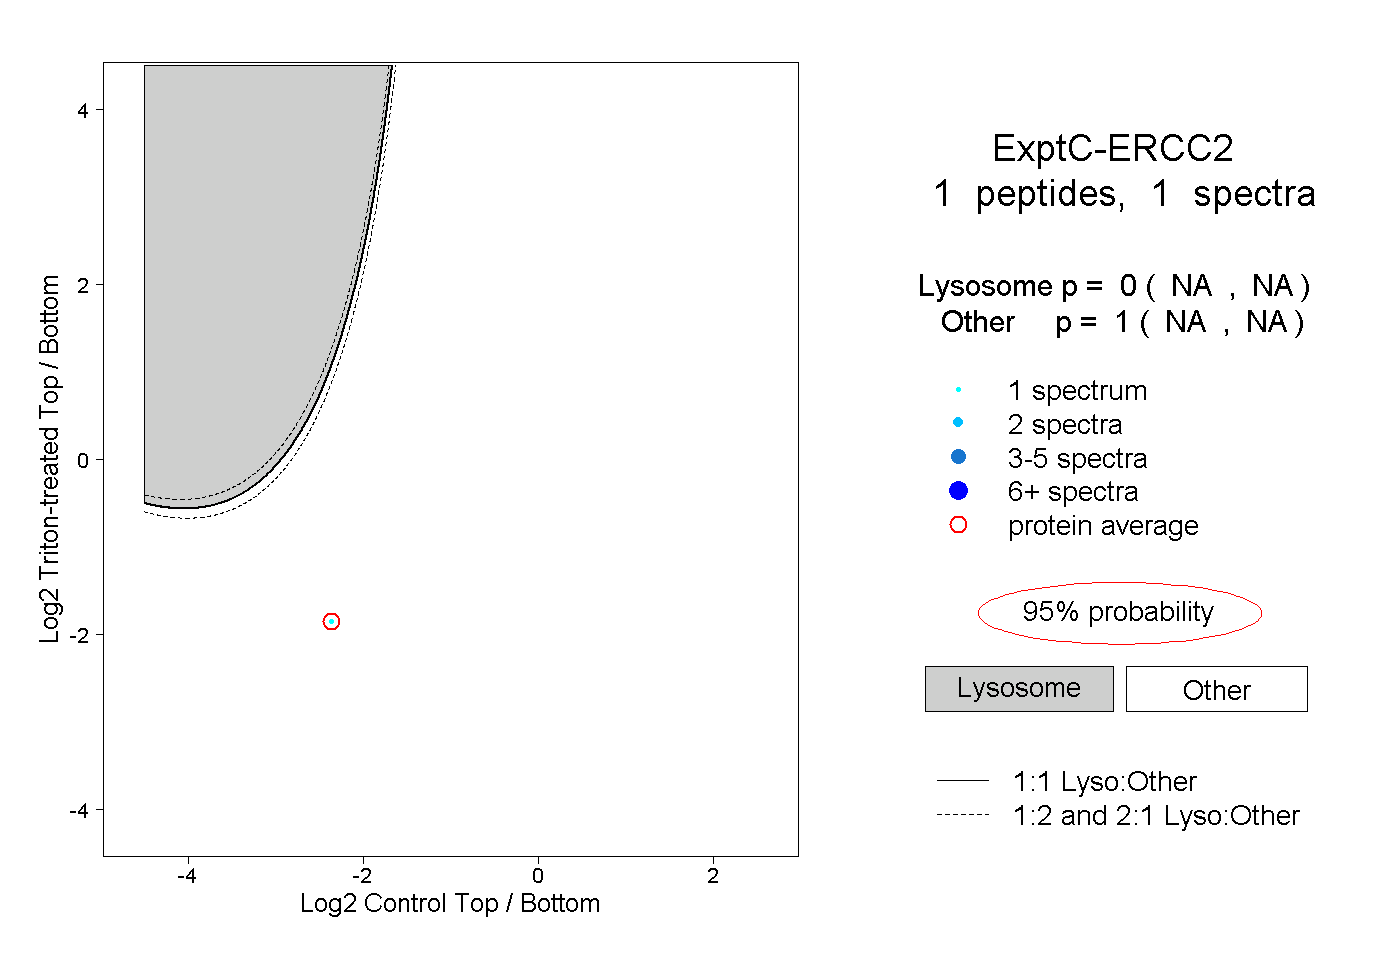 |
0.000 NA | NA |
1.000 NA | NA |