ABCB10
[ENSRNOP00000024232]
Main page
| | | Plot |
Mito |
Lyso |
|
Perox |
ER |
Golgi |
PM |
Cytosol |
Nucleus |
|
| Expt A |
 13
13
peptides |
35
spectra |
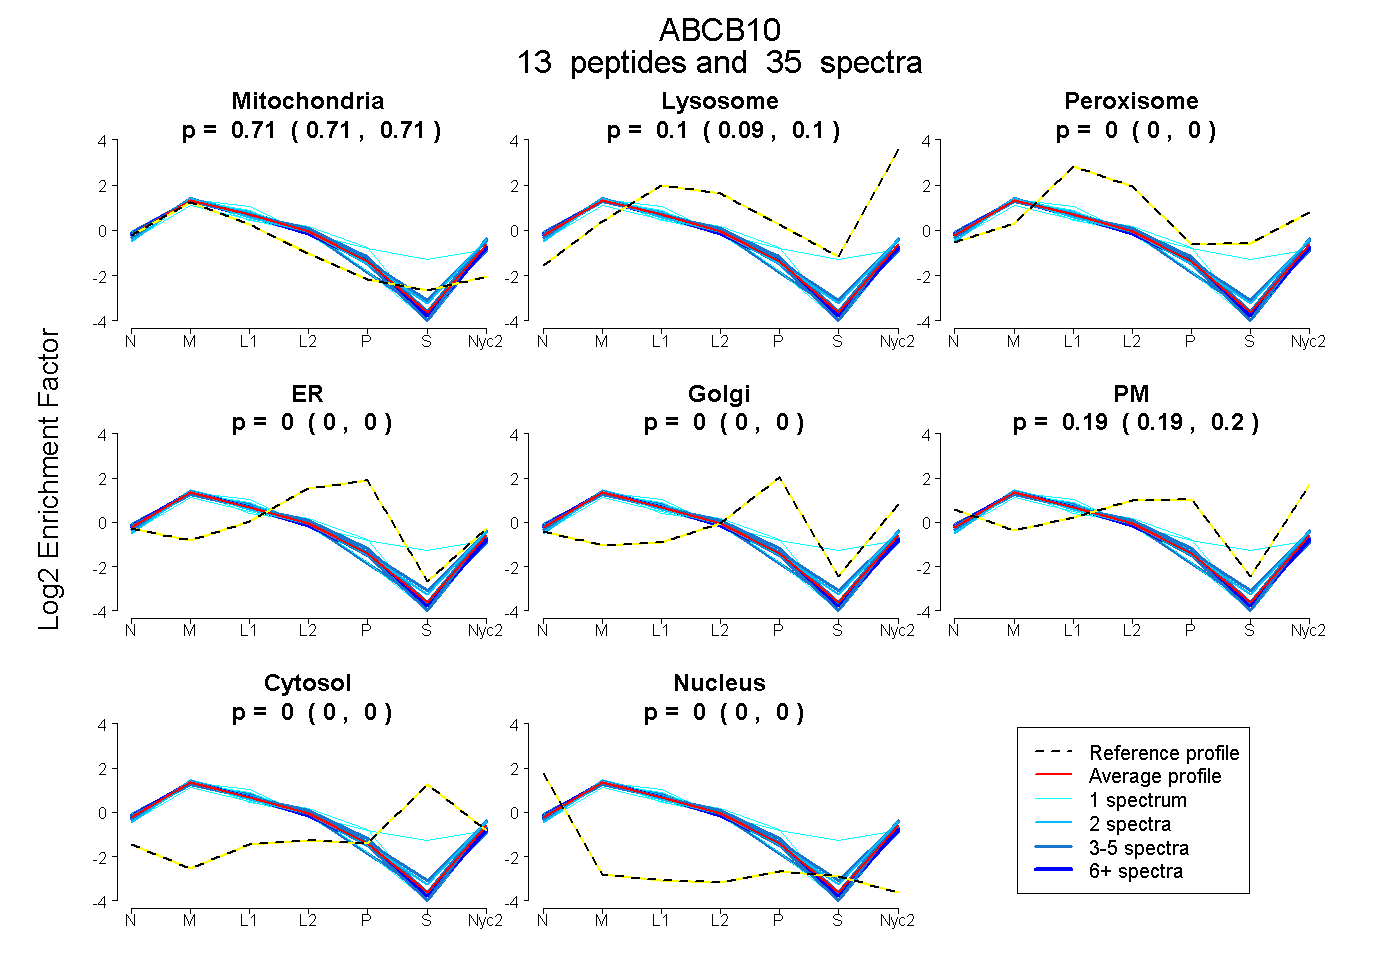 |
0.710
0.706 | 0.712 |
0.095
0.090 | 0.100 |
|
0.000
0.000 | 0.000 |
0.000
0.000 | 0.000 |
0.000
0.000 | 0.000 |
0.195
0.188 | 0.201 |
0.000
0.000 | 0.000 |
0.000
0.000 | 0.000 |
|
| | | Plot |
Mito |
|
Lyso or Perox |
|
ER |
Golgi |
PM |
Cytosol |
Nucleus |
|
| Expt B |
10
peptides |
21
spectra |
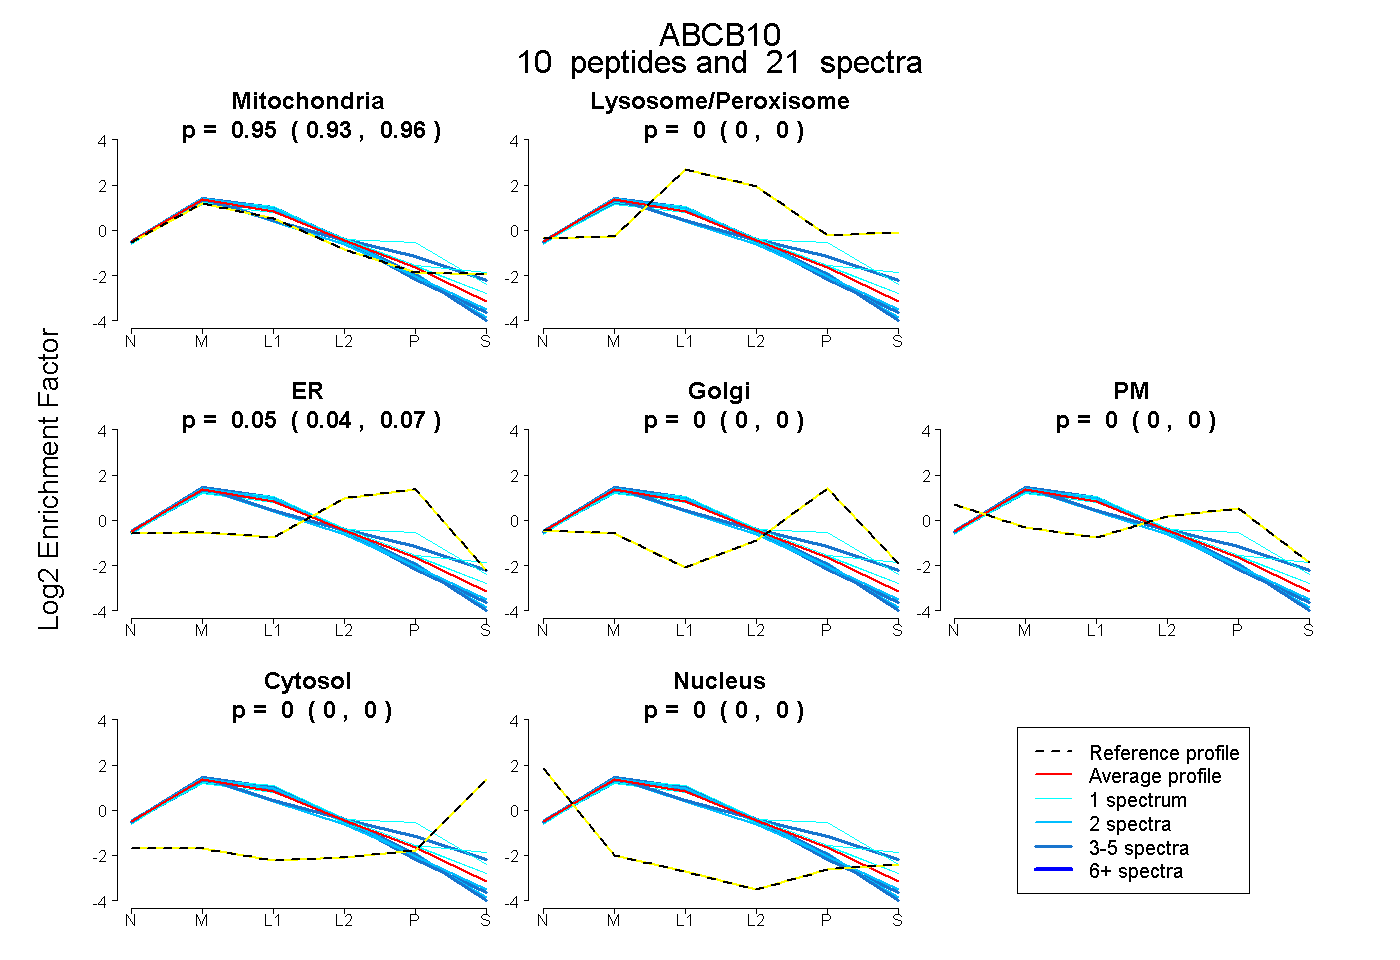 |
0.946
0.933 | 0.955 |
|
0.000
0.000 | 0.000 |
|
0.054
0.042 | 0.065 |
0.000
0.000 | 0.000 |
0.000
0.000 | 0.000 |
0.000
0.000 | 0.000 |
0.000
0.000 | 0.000 |
|
| 3 spectra, LWELLER |
0.823 |
|
0.088 |
|
0.089 |
0.000 |
0.000 |
0.000 |
0.000 |
|
| 1 spectrum, QLNPVWLR |
0.716 |
|
0.040 |
|
0.245 |
0.000 |
0.000 |
0.000 |
0.000 |
|
| 1 spectrum, TFQGALEFR |
0.866 |
|
0.134 |
|
0.000 |
0.000 |
0.000 |
0.000 |
0.000 |
|
| 1 spectrum, LPFNEGIVLDEK |
0.960 |
|
0.000 |
|
0.040 |
0.000 |
0.000 |
0.000 |
0.000 |
|
| 2 spectra, VDQLLQLAR |
1.000 |
|
0.000 |
|
0.000 |
0.000 |
0.000 |
0.000 |
0.000 |
|
| 1 spectrum, TVLIIAHR |
0.923 |
|
0.036 |
|
0.040 |
0.000 |
0.000 |
0.000 |
0.000 |
|
| 2 spectra, AAEVANAAEFIR |
1.000 |
|
0.000 |
|
0.000 |
0.000 |
0.000 |
0.000 |
0.000 |
|
| 2 spectra, STVVSLLLR |
0.989 |
|
0.000 |
|
0.008 |
0.000 |
0.000 |
0.000 |
0.004 |
|
| 4 spectra, TSLFSSILR |
0.960 |
|
0.000 |
|
0.040 |
0.000 |
0.000 |
0.000 |
0.000 |
|
| 4 spectra, LLGLVRPER |
1.000 |
|
0.000 |
|
0.000 |
0.000 |
0.000 |
0.000 |
0.000 |
|
| | | Plot |
|
Lyso |
|
|
|
|
|
|
|
Other |
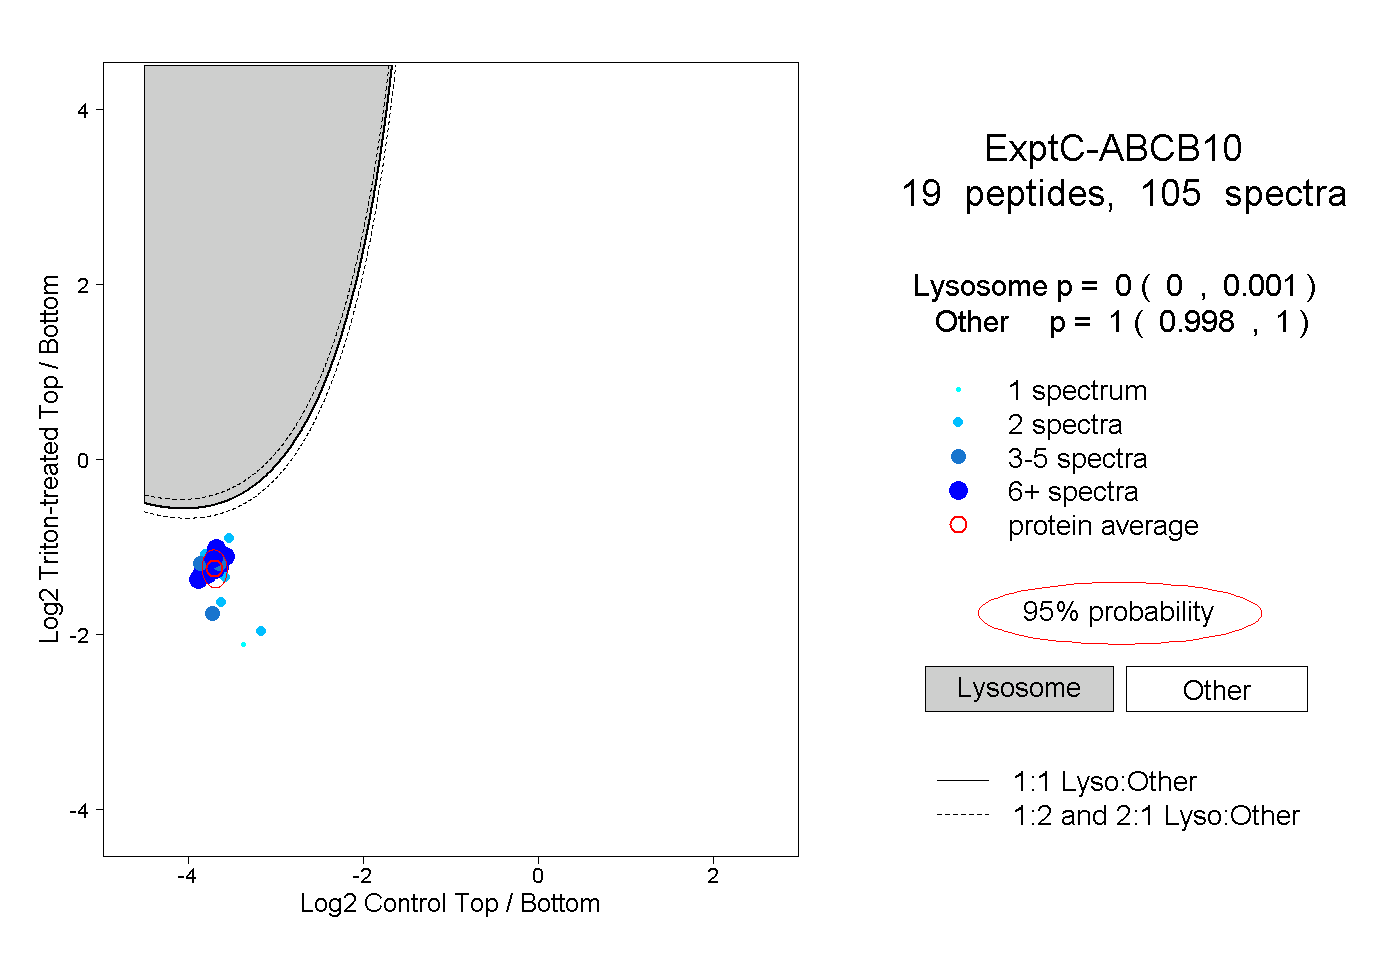
| Expt C |
19
peptides |
105
spectra |
 |
|
0.000
0.000 | 0.001 |
|
|
|
|
|
|
|
1.000
0.998 | 1.000 |
| | | Plot |
|
Lyso |
|
|
|
|
|
|
|
Other |
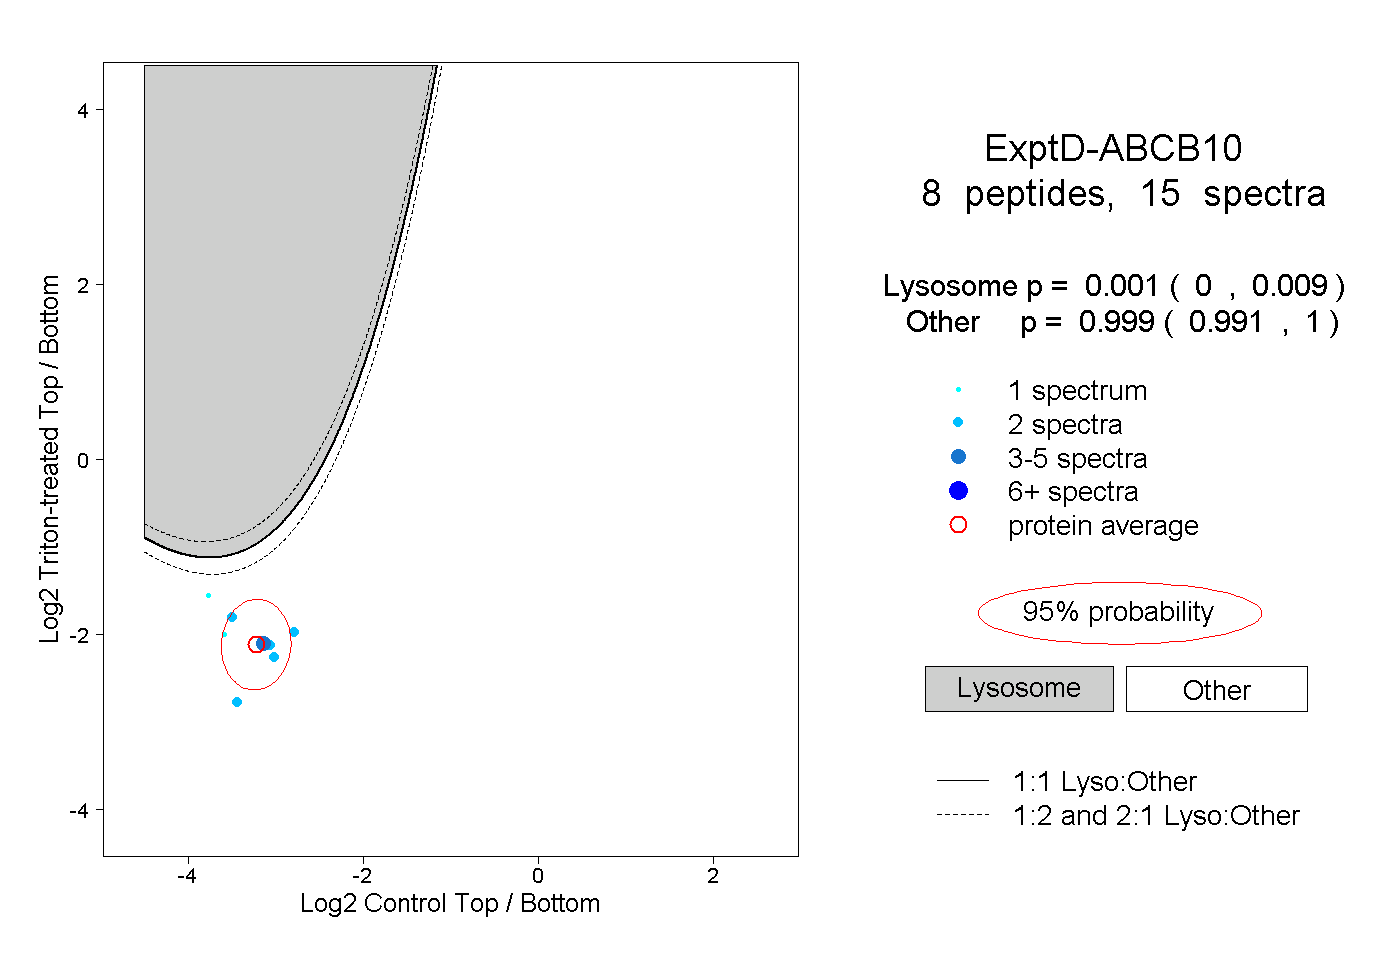
| Expt D |
8
peptides |
15
spectra |
 |
|
0.001
0.000 | 0.009 |
|
|
|
|
|
|
|
0.999
0.991 | 1.000 |