 13
13peptides
spectra
0.706 | 0.712
0.090 | 0.100
0.000 | 0.000
0.000 | 0.000
0.000 | 0.000
0.188 | 0.201
0.000 | 0.000
0.000 | 0.000
| Plot | Mito | Lyso | Perox | ER | Golgi | PM | Cytosol | Nucleus | |||||
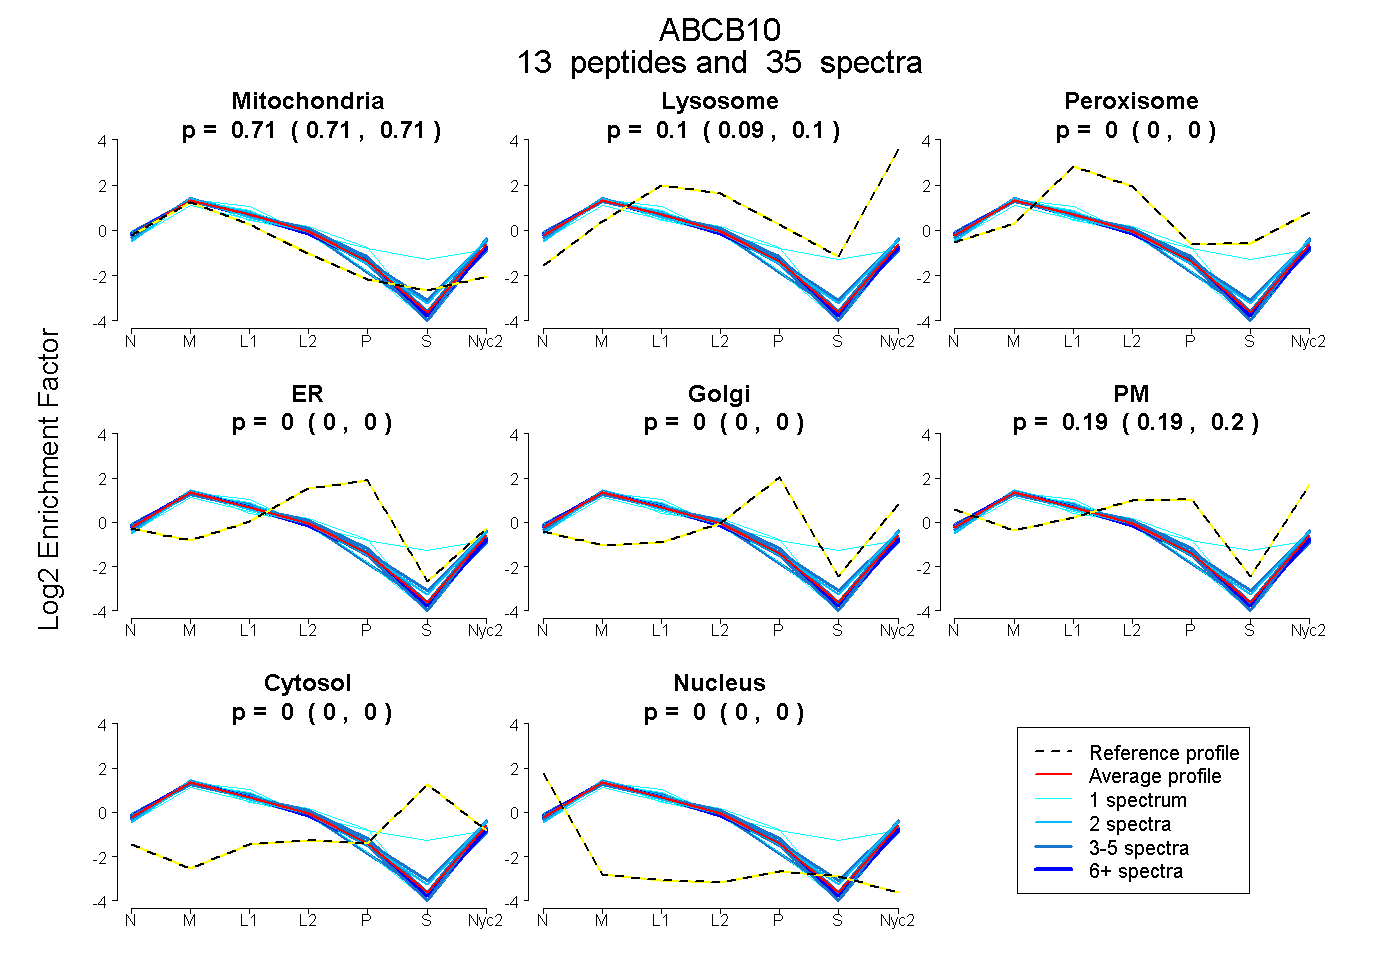
| Expt A |
13 peptides |
35 spectra |
|
0.710 0.706 | 0.712 |
0.095 0.090 | 0.100 |
0.000 0.000 | 0.000 |
0.000 0.000 | 0.000 |
0.000 0.000 | 0.000 |
0.195 0.188 | 0.201 |
0.000 0.000 | 0.000 |
0.000 0.000 | 0.000 |
| 1 spectrum, LWELLER | 0.757 | 0.096 | 0.000 | 0.000 | 0.000 | 0.147 | 0.000 | 0.000 | ||
| 1 spectrum, ATQDSLAEATQLAEER | 0.778 | 0.099 | 0.000 | 0.000 | 0.000 | 0.123 | 0.000 | 0.000 | ||
| 1 spectrum, SFPQGFDTVVGEK | 0.696 | 0.045 | 0.000 | 0.000 | 0.000 | 0.259 | 0.000 | 0.000 | ||
| 2 spectra, QLNPVWLR | 0.734 | 0.100 | 0.000 | 0.000 | 0.000 | 0.166 | 0.000 | 0.000 | ||
| 4 spectra, TFQGALEFR | 0.659 | 0.115 | 0.000 | 0.000 | 0.000 | 0.227 | 0.000 | 0.000 | ||
| 3 spectra, LPFNEGIVLDEK | 0.789 | 0.087 | 0.000 | 0.000 | 0.000 | 0.123 | 0.000 | 0.000 | ||
| 1 spectrum, QEVAFFDK | 0.625 | 0.011 | 0.000 | 0.140 | 0.000 | 0.224 | 0.000 | 0.000 | ||
| 2 spectra, VDQLLQLAR | 0.706 | 0.186 | 0.000 | 0.000 | 0.000 | 0.108 | 0.000 | 0.000 | ||
| 5 spectra, TVLIIAHR | 0.681 | 0.147 | 0.000 | 0.000 | 0.000 | 0.172 | 0.000 | 0.000 | ||
| 6 spectra, STVVSLLLR | 0.730 | 0.050 | 0.000 | 0.000 | 0.000 | 0.220 | 0.000 | 0.000 | ||
| 4 spectra, AAEVANAAEFIR | 0.692 | 0.020 | 0.000 | 0.000 | 0.000 | 0.288 | 0.000 | 0.000 | ||
| 4 spectra, TSLFSSILR | 0.701 | 0.098 | 0.000 | 0.000 | 0.000 | 0.201 | 0.000 | 0.000 | ||
| 1 spectrum, LLGLVRPER | 0.534 | 0.039 | 0.242 | 0.000 | 0.114 | 0.000 | 0.071 | 0.000 |
| Plot | Mito | Lyso or Perox | ER | Golgi | PM | Cytosol | Nucleus | ||||||
| Expt B |
10 peptides |
21 spectra |
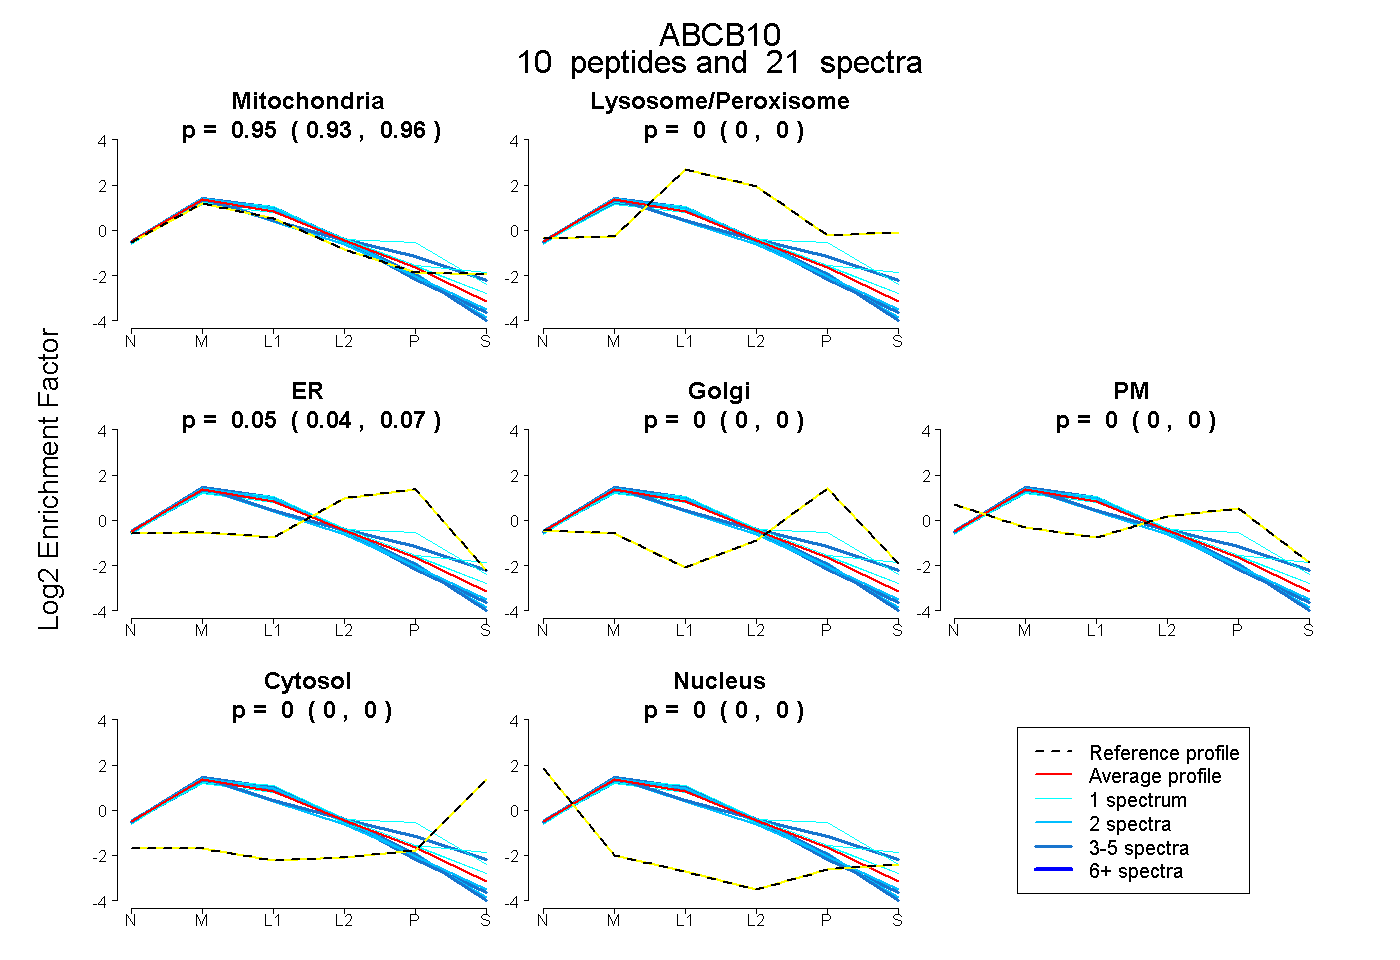 |
0.946 0.933 | 0.955 |
0.000 0.000 | 0.000 |
0.054 0.042 | 0.065 |
0.000 0.000 | 0.000 |
0.000 0.000 | 0.000 |
0.000 0.000 | 0.000 |
0.000 0.000 | 0.000 |
|||
| Plot | Lyso | Other | |||||||||||
| Expt C |
19 peptides |
105 spectra |
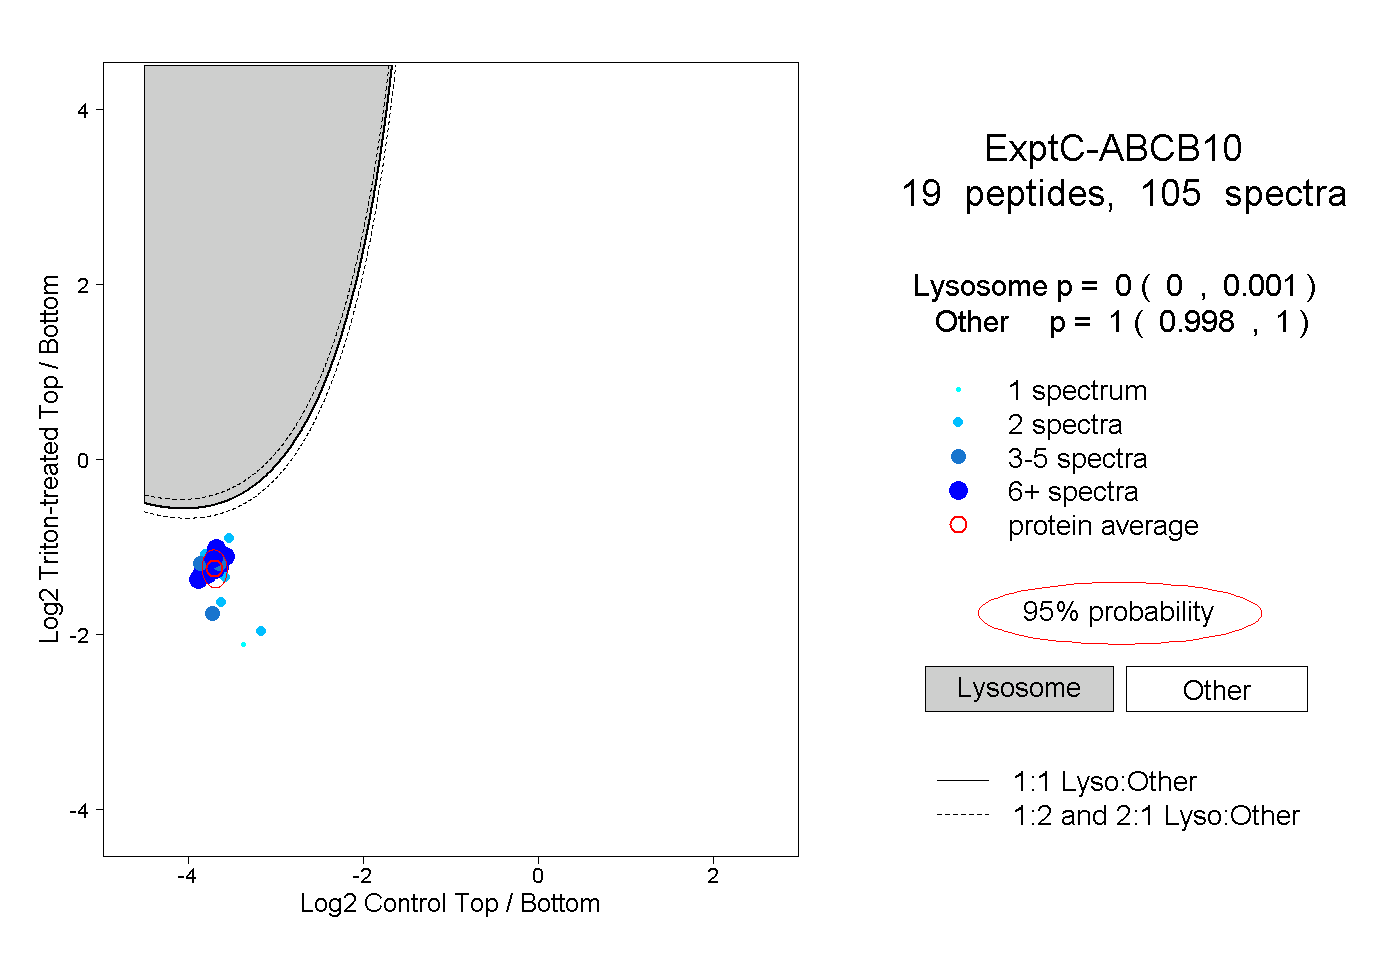 |
0.000 0.000 | 0.001 |
1.000 0.998 | 1.000 |
||||||||
| Plot | Lyso | Other | |||||||||||
| Expt D |
8 peptides |
15 spectra |
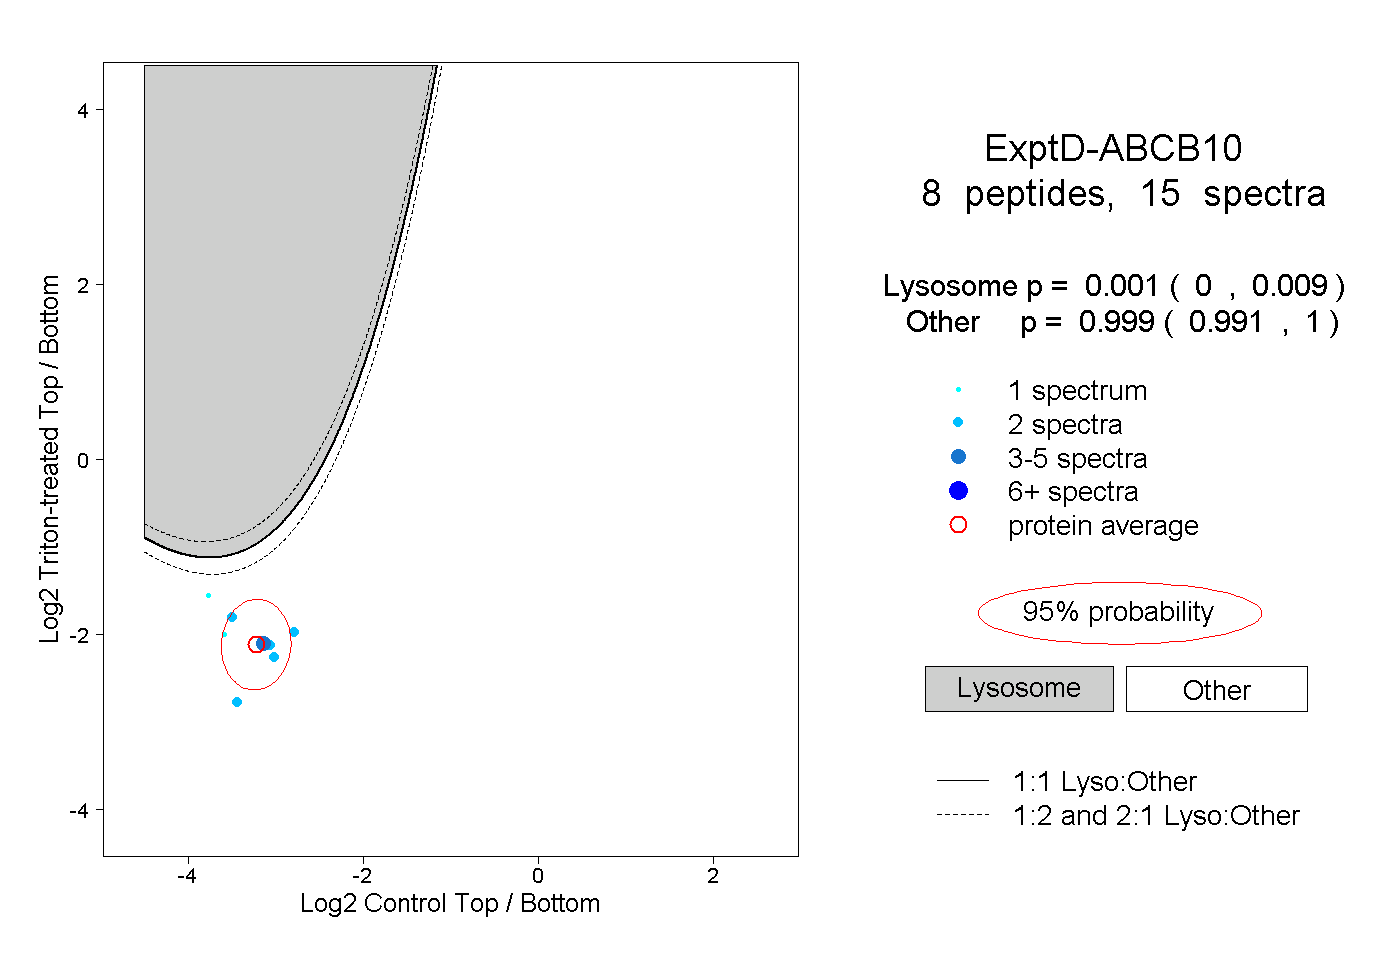 |
0.001 0.000 | 0.009 |
0.999 0.991 | 1.000 |