 13
13peptides
spectra
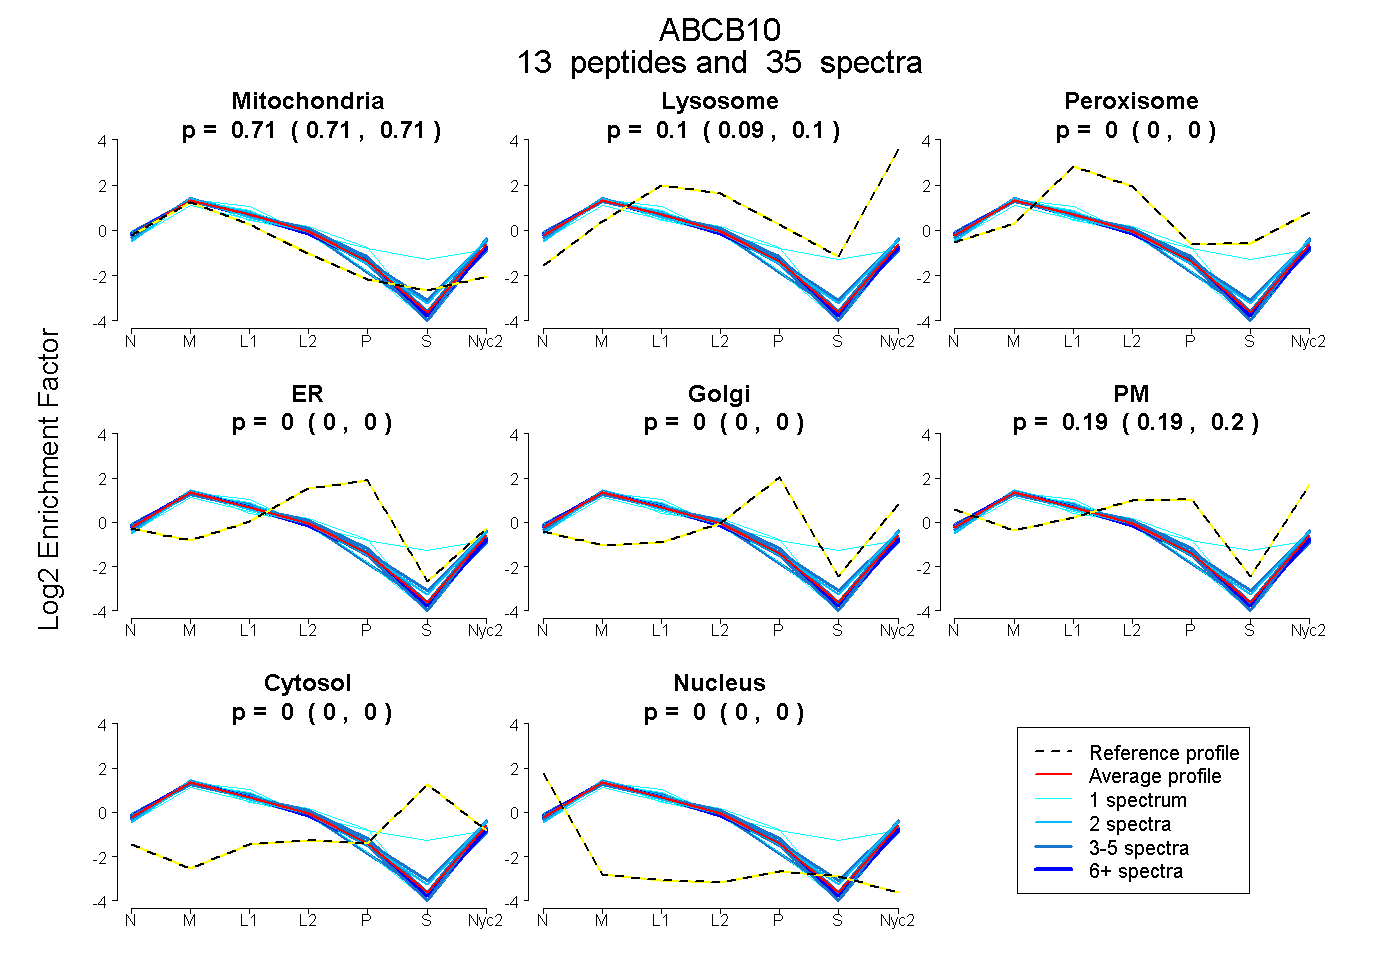
0.706 | 0.712
0.090 | 0.100
0.000 | 0.000
0.000 | 0.000
0.000 | 0.000
0.188 | 0.201
0.000 | 0.000
0.000 | 0.000
10peptides
spectra
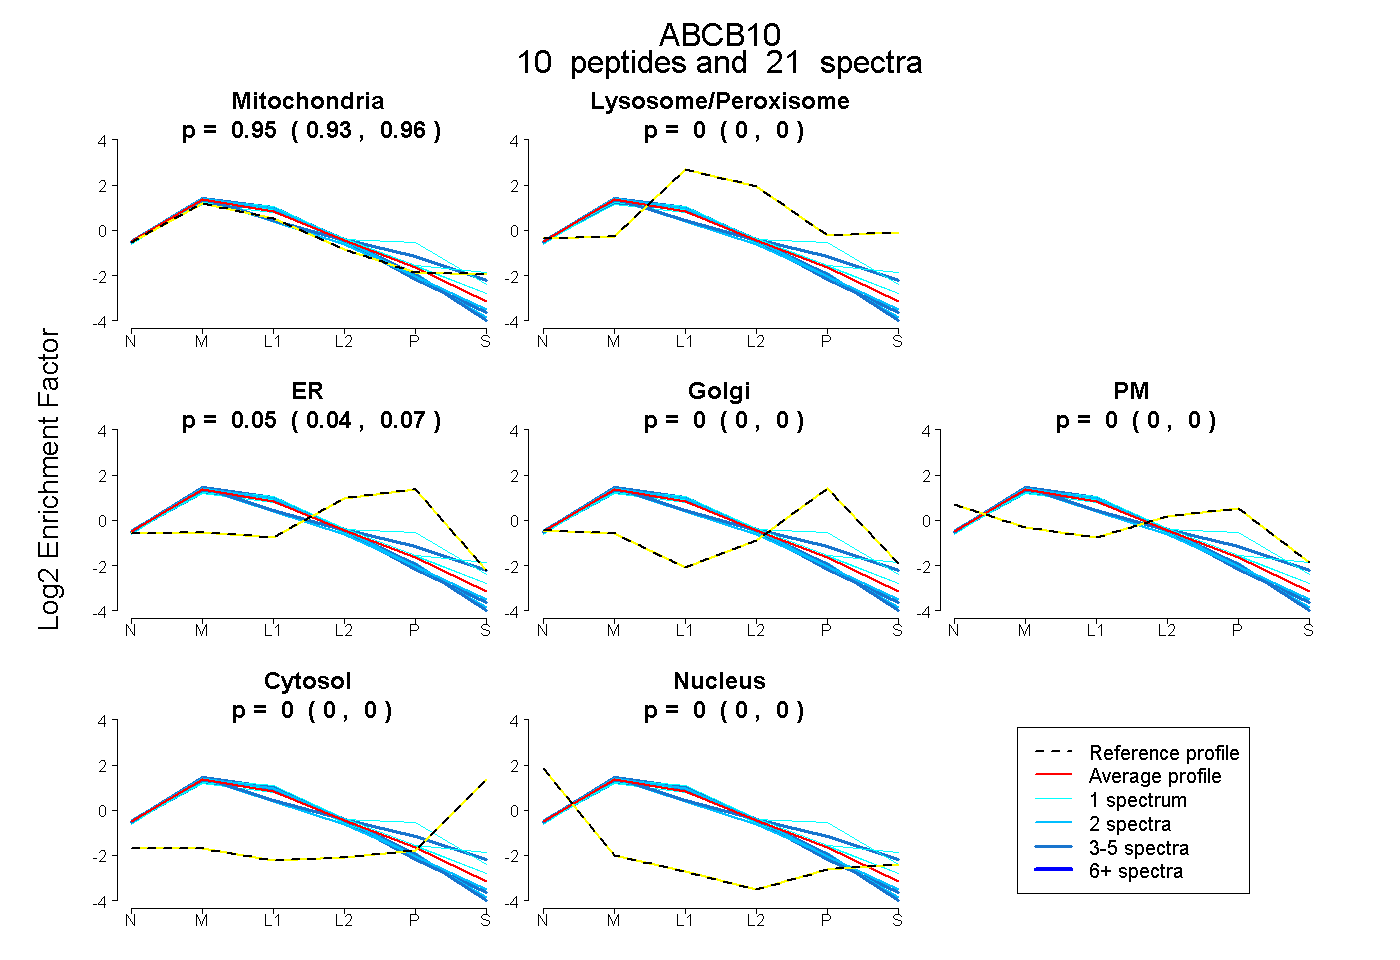
0.933 | 0.955
0.000 | 0.000
0.042 | 0.065
0.000 | 0.000
0.000 | 0.000
0.000 | 0.000
0.000 | 0.000
19peptides
spectra
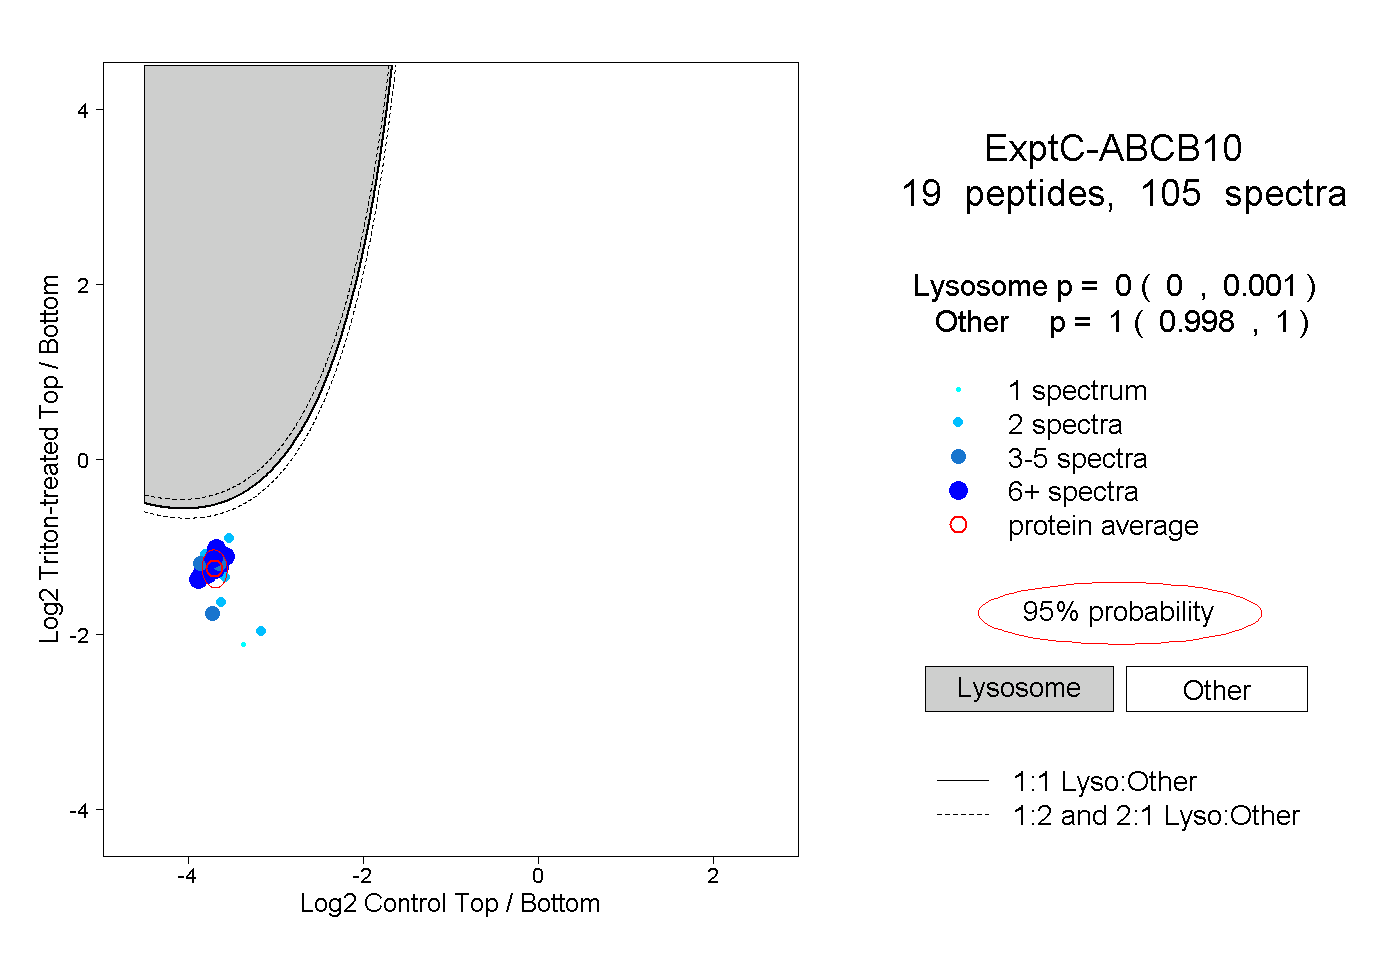
0.000 | 0.001
0.998 | 1.000
8peptides
spectra
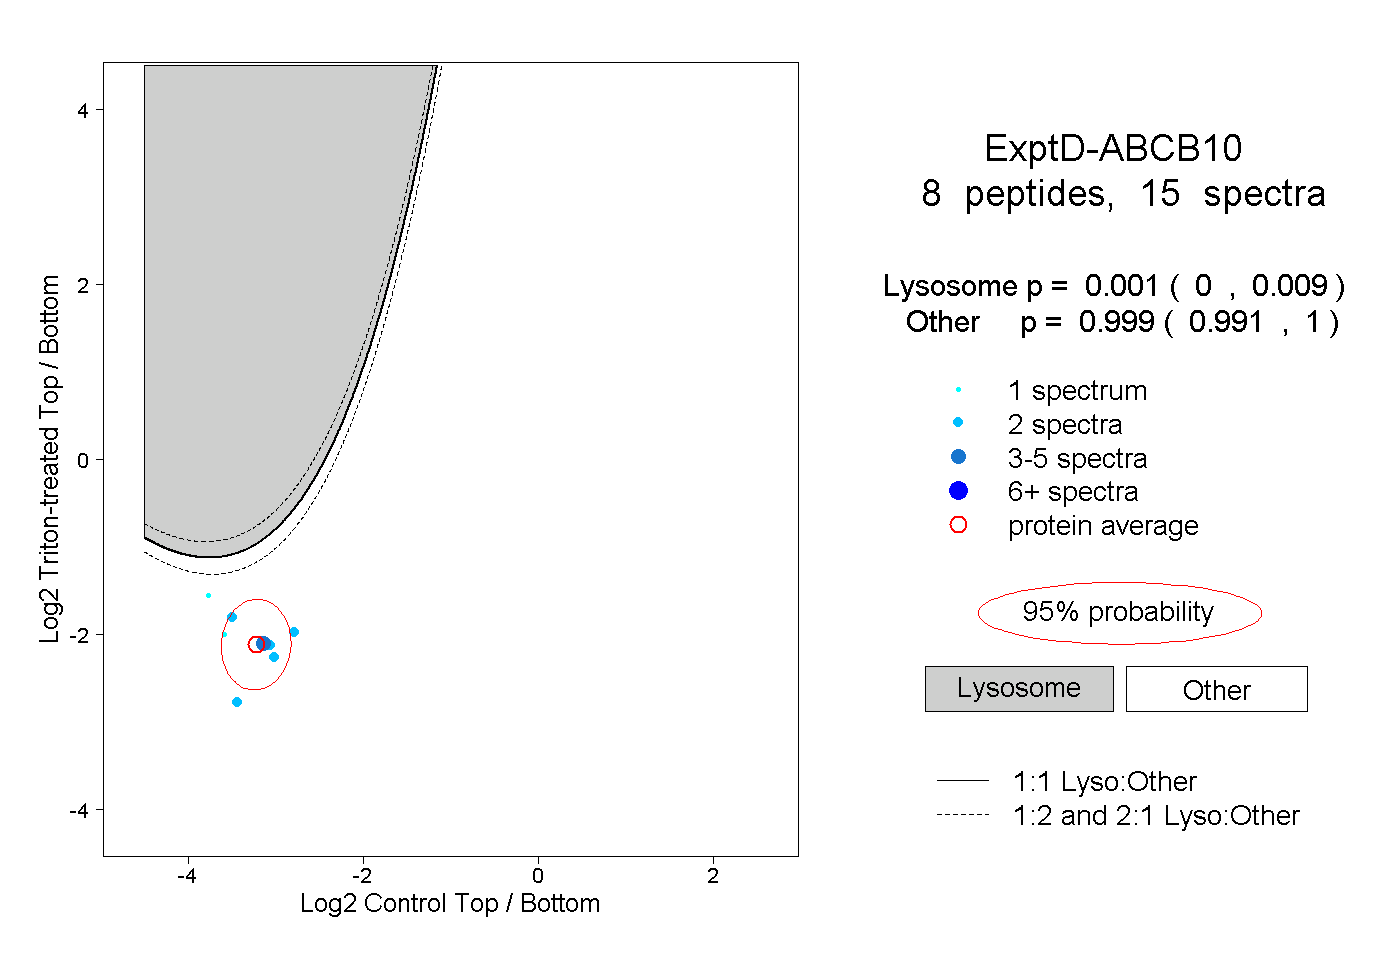
0.000 | 0.009
0.991 | 1.000