 4
4peptides
spectra
0.000 | 0.000
0.000 | 0.000
0.000 | 0.000
0.054 | 0.204
0.000 | 0.092
0.000 | 0.000
0.000 | 0.020
0.787 | 0.841
1peptide
spectrum
NA | NA
NA | NA
NA | NA
NA | NA
NA | NA
NA | NA
NA | NA
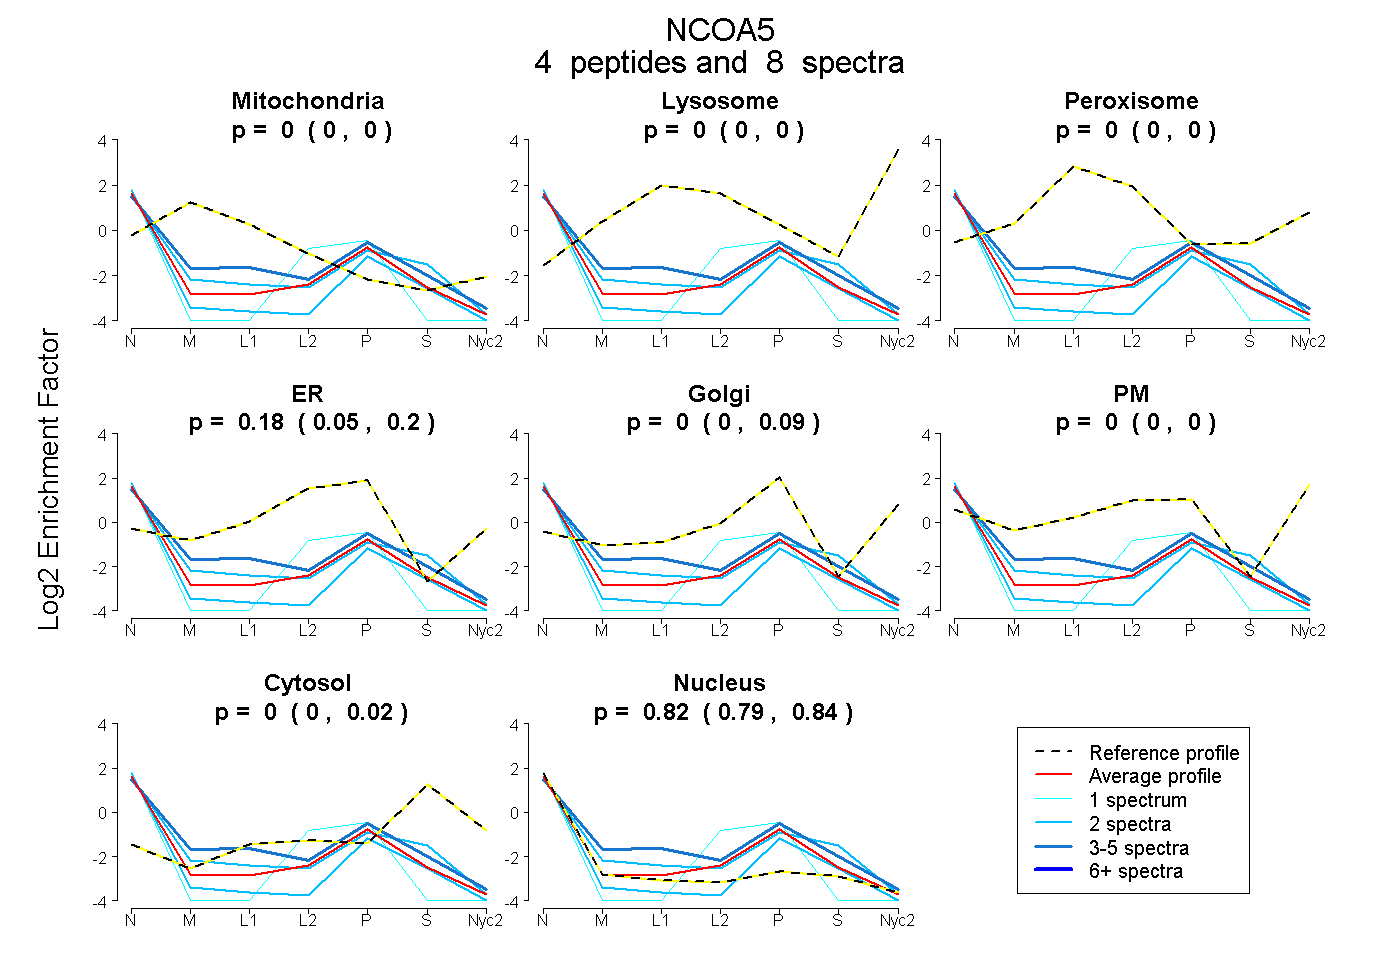
| Plot | Mito | Lyso | Perox | ER | Golgi | PM | Cytosol | Nucleus | |||||
| Expt A |
4 peptides |
8 spectra |
|
0.000 0.000 | 0.000 |
0.000 0.000 | 0.000 |
0.000 0.000 | 0.000 |
0.179 0.054 | 0.204 |
0.000 0.000 | 0.092 |
0.000 0.000 | 0.000 |
0.000 0.000 | 0.020 |
0.821 0.787 | 0.841 |
||
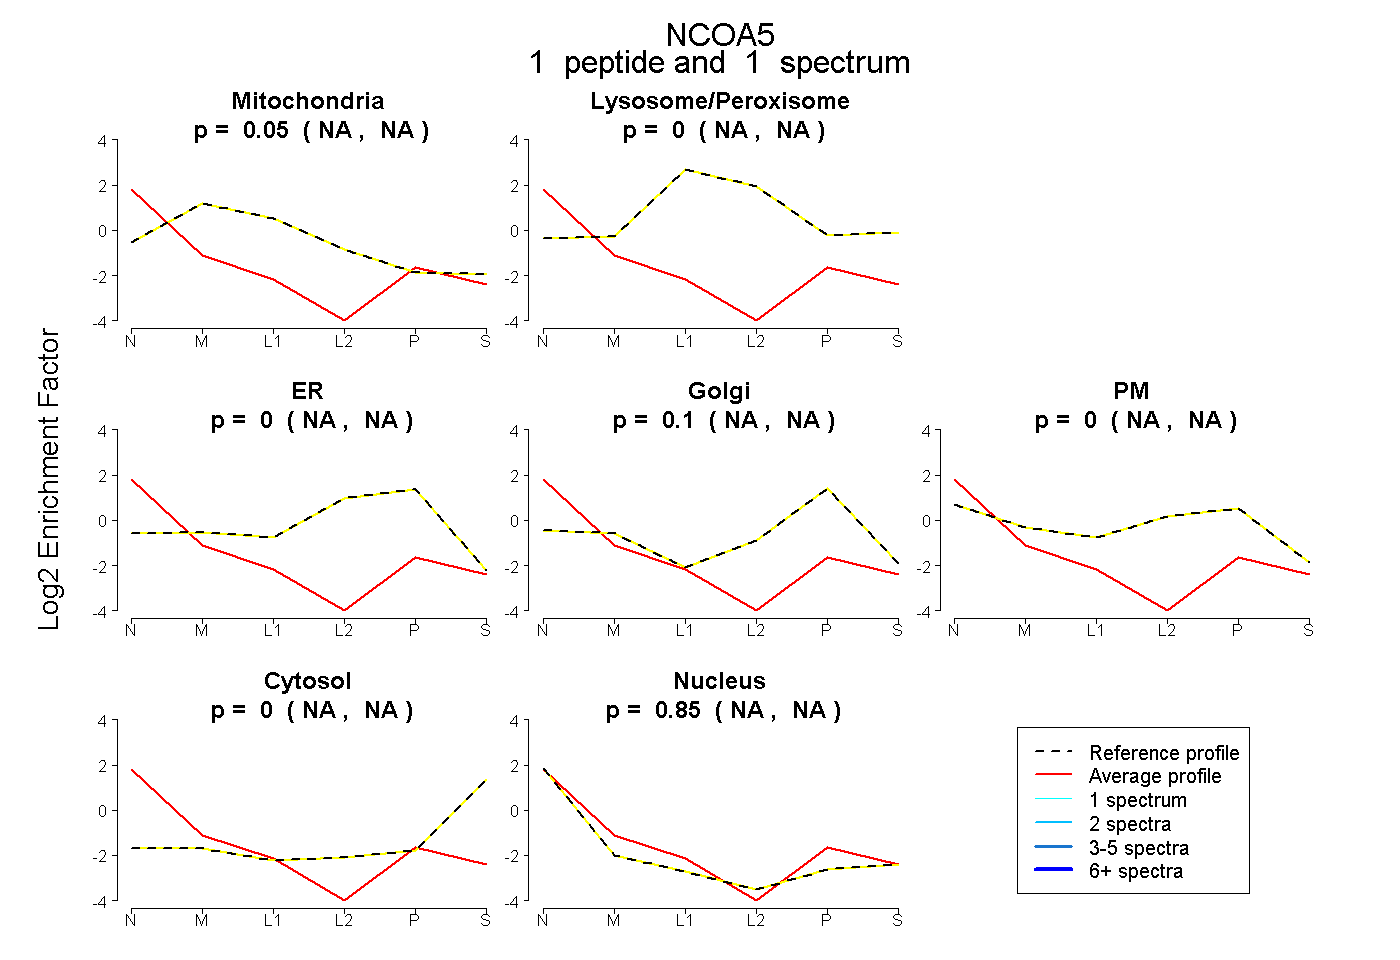
| Plot | Mito | Lyso or Perox | ER | Golgi | PM | Cytosol | Nucleus | ||||||
| Expt B |
1 peptide |
1 spectrum |
|
0.053 NA | NA |
0.000 NA | NA |
0.000 NA | NA |
0.097 NA | NA |
0.000 NA | NA |
0.000 NA | NA |
0.850 NA | NA |