 2
2peptides
spectra
NA | NA
NA | NA
NA | NA
NA | NA
NA | NA
NA | NA
NA | NA
NA | NA
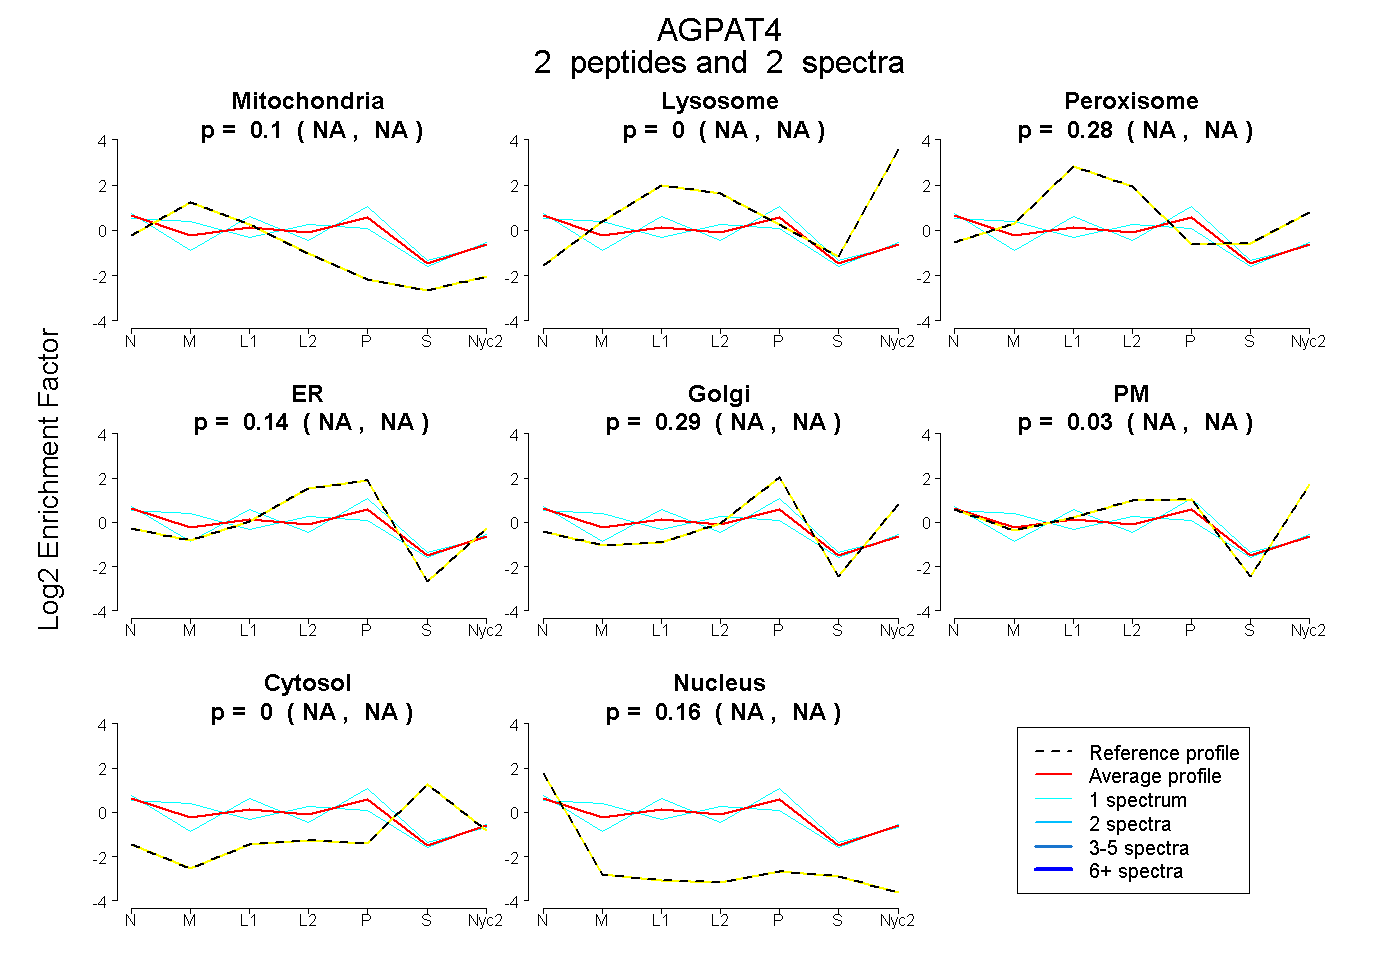
| Plot | Mito | Lyso | Perox | ER | Golgi | PM | Cytosol | Nucleus | |||||
| Expt A |
2 peptides |
2 spectra |
|
0.104 NA | NA |
0.000 NA | NA |
0.275 NA | NA |
0.138 NA | NA |
0.292 NA | NA |
0.033 NA | NA |
0.000 NA | NA |
0.158 NA | NA |
| 1 spectrum, LGILGNSK | 0.349 | 0.000 | 0.000 | 0.197 | 0.000 | 0.346 | 0.100 | 0.008 | ||
| 1 spectrum, SLLHLR | 0.000 | 0.000 | 0.323 | 0.119 | 0.360 | 0.000 | 0.000 | 0.198 |
| Plot | Lyso | Other | |||||||||||
| Expt C |
2 peptides |
3 spectra |
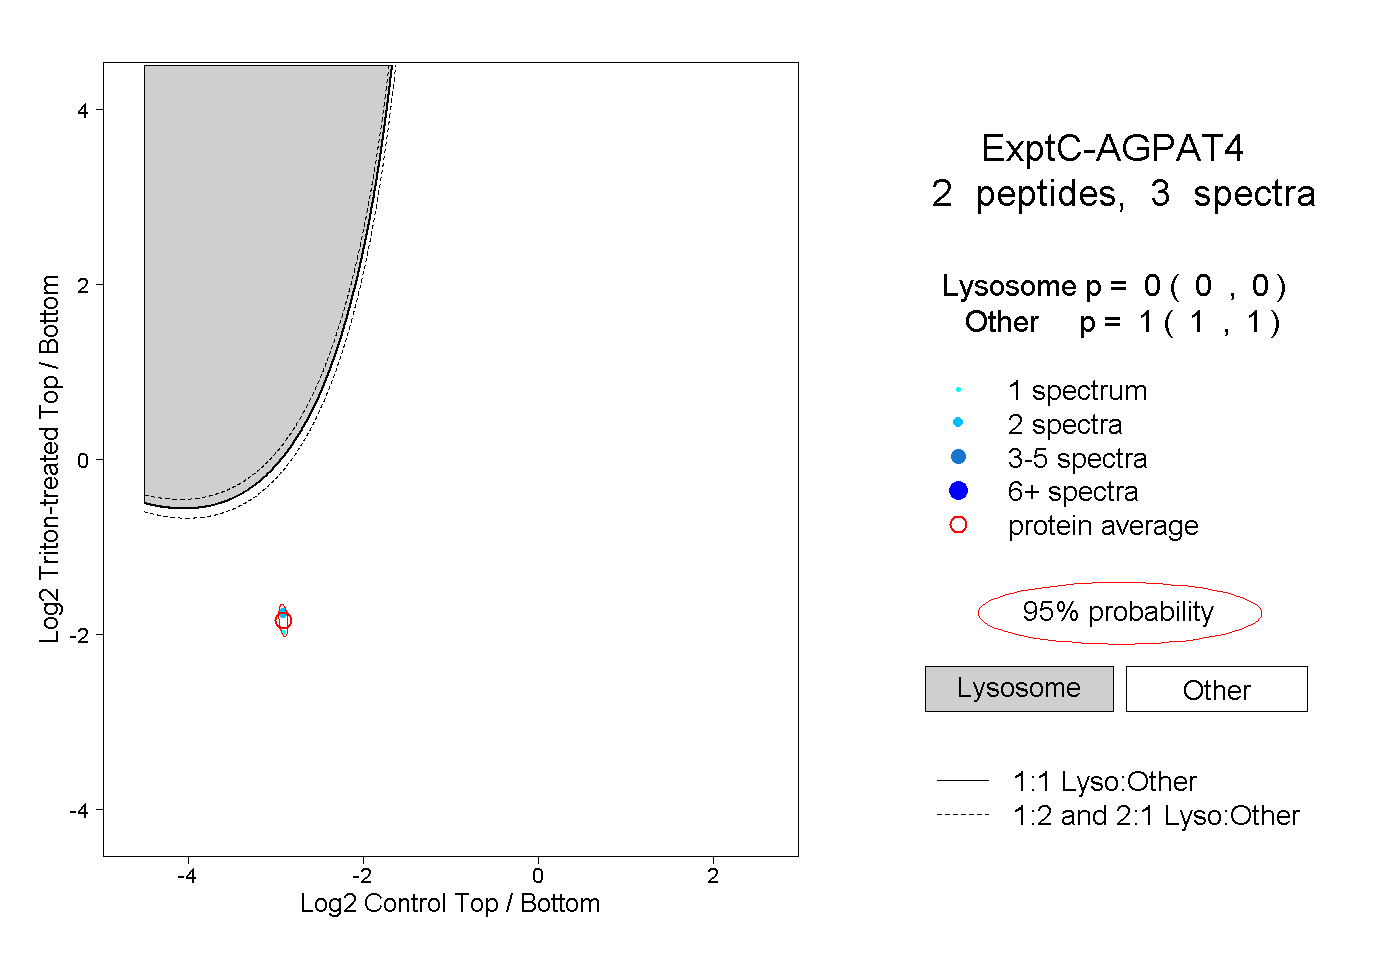 |
0.000 0.000 | 0.000 |
1.000 1.000 | 1.000 |