17
17peptides
spectra
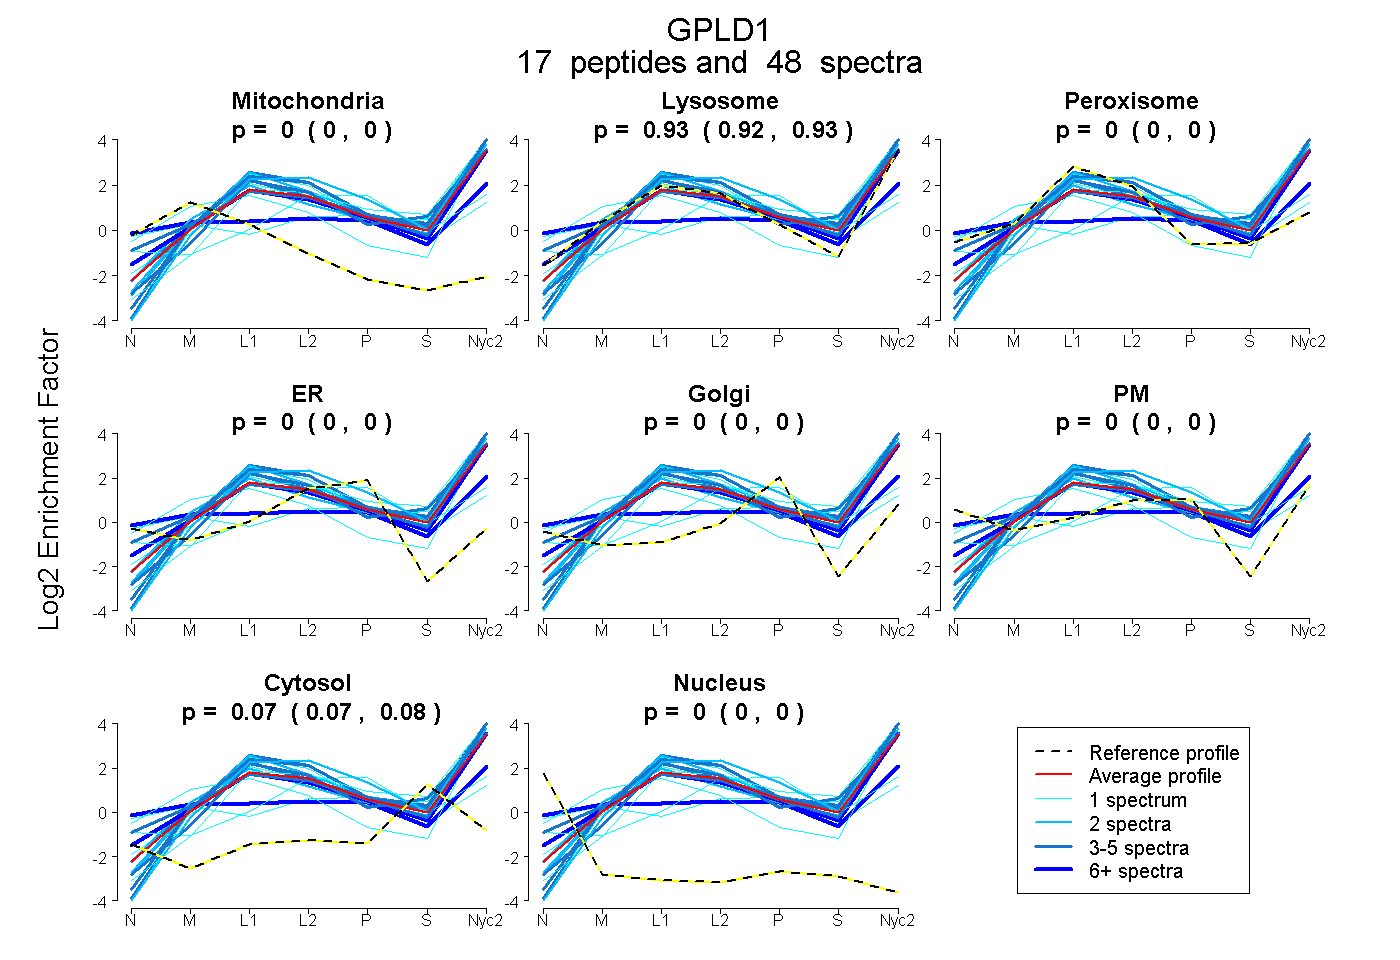
0.000 | 0.000
0.920 | 0.932
0.000 | 0.000
0.000 | 0.000
0.000 | 0.000
0.000 | 0.000
0.067 | 0.079
0.000 | 0.000
7peptides
spectra
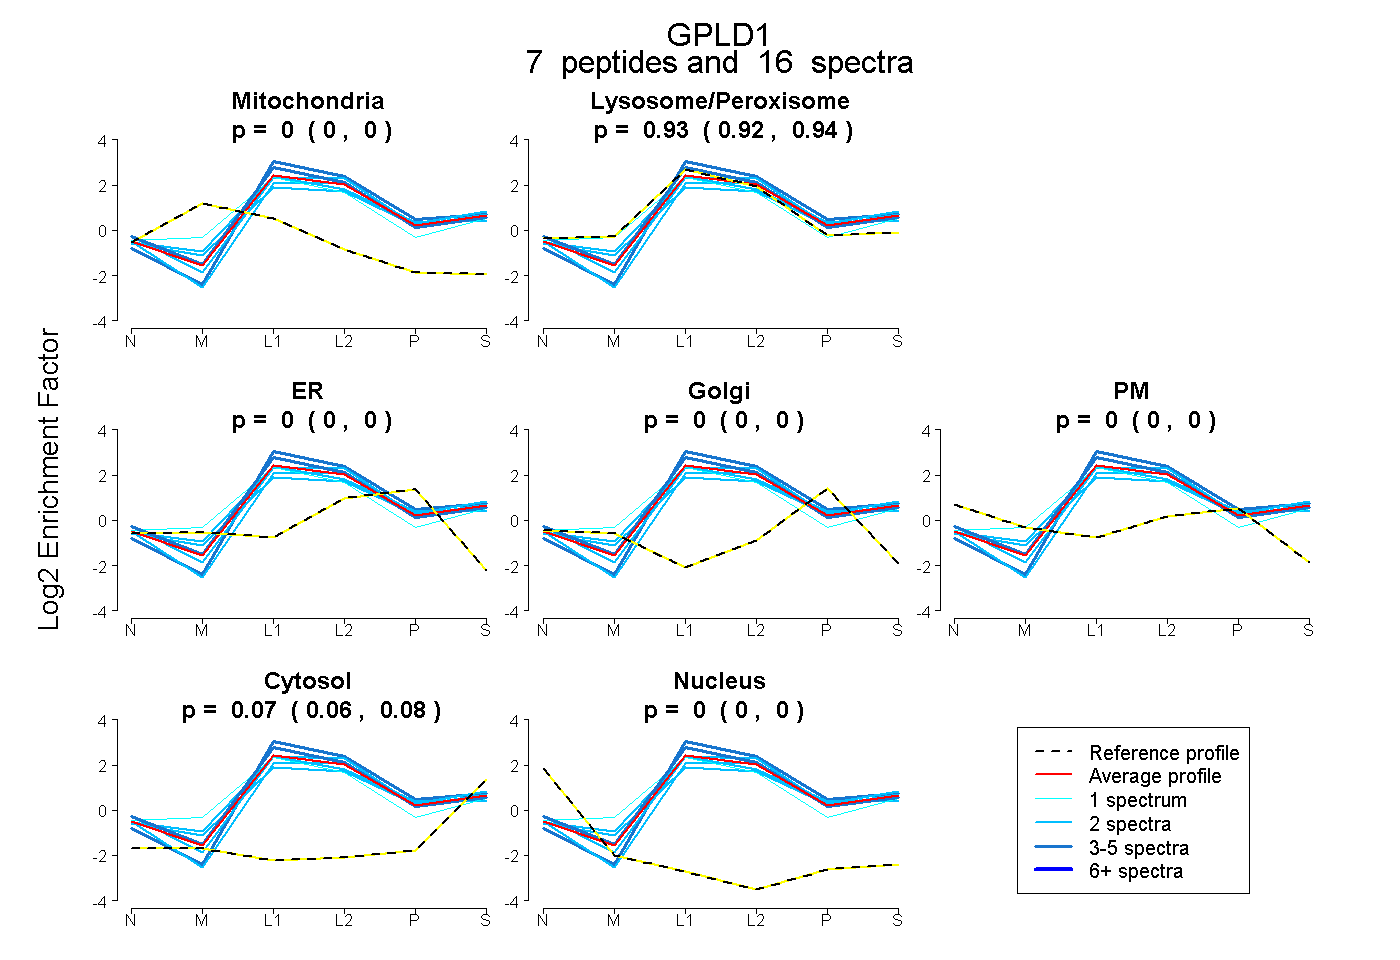
0.000 | 0.000
0.919 | 0.936
0.000 | 0.000
0.000 | 0.000
0.000 | 0.000
0.062 | 0.080
0.000 | 0.000