6
6peptides
spectra
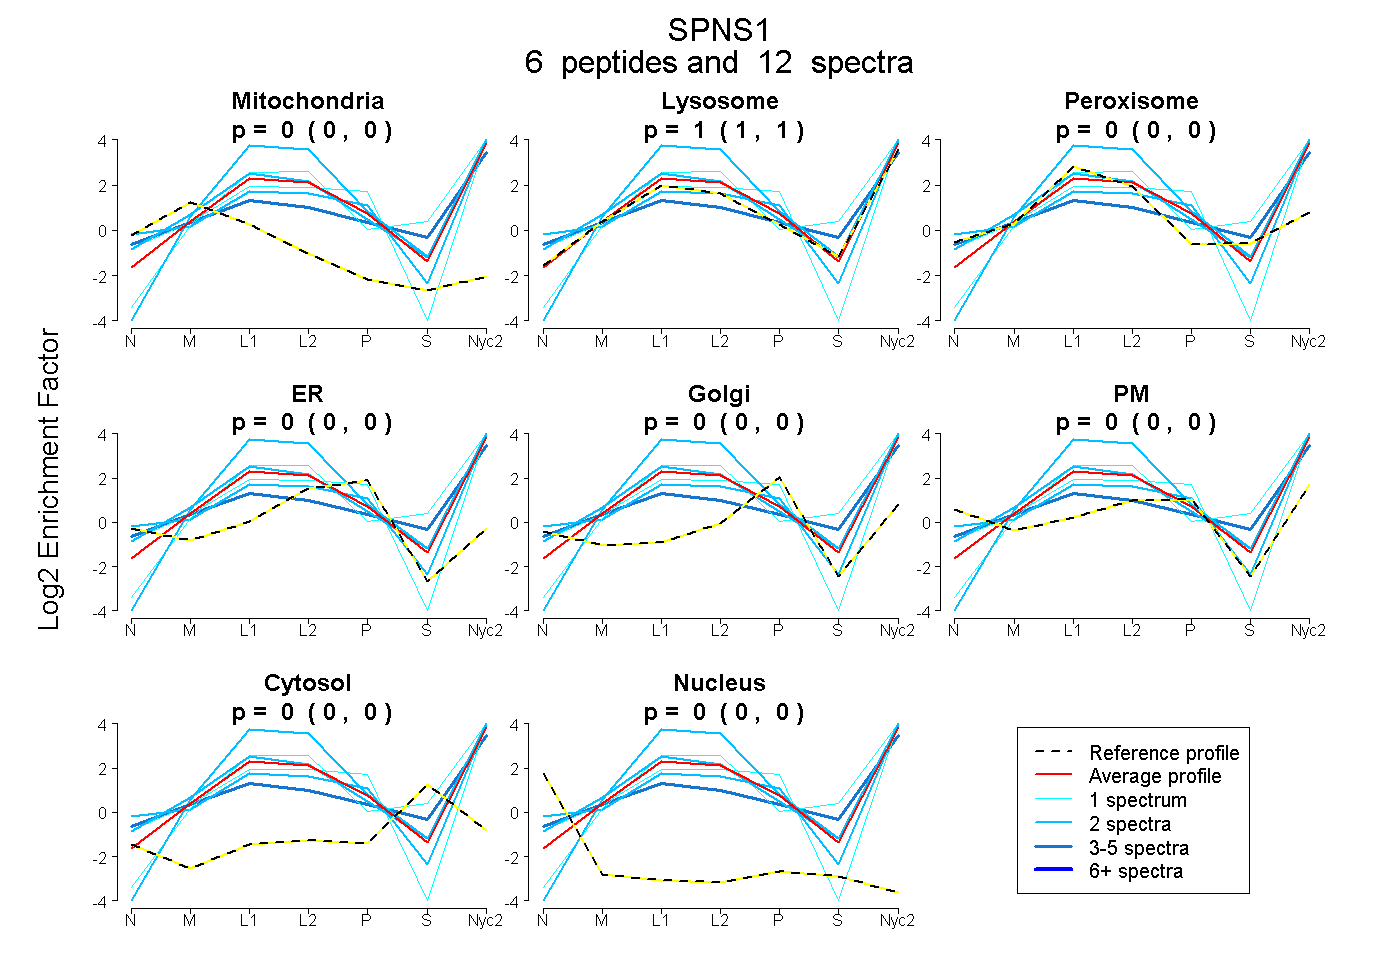
0.000 | 0.000
0.997 | 1.000
0.000 | 0.000
0.000 | 0.000
0.000 | 0.000
0.000 | 0.000
0.000 | 0.000
0.000 | 0.000
4peptides
spectra
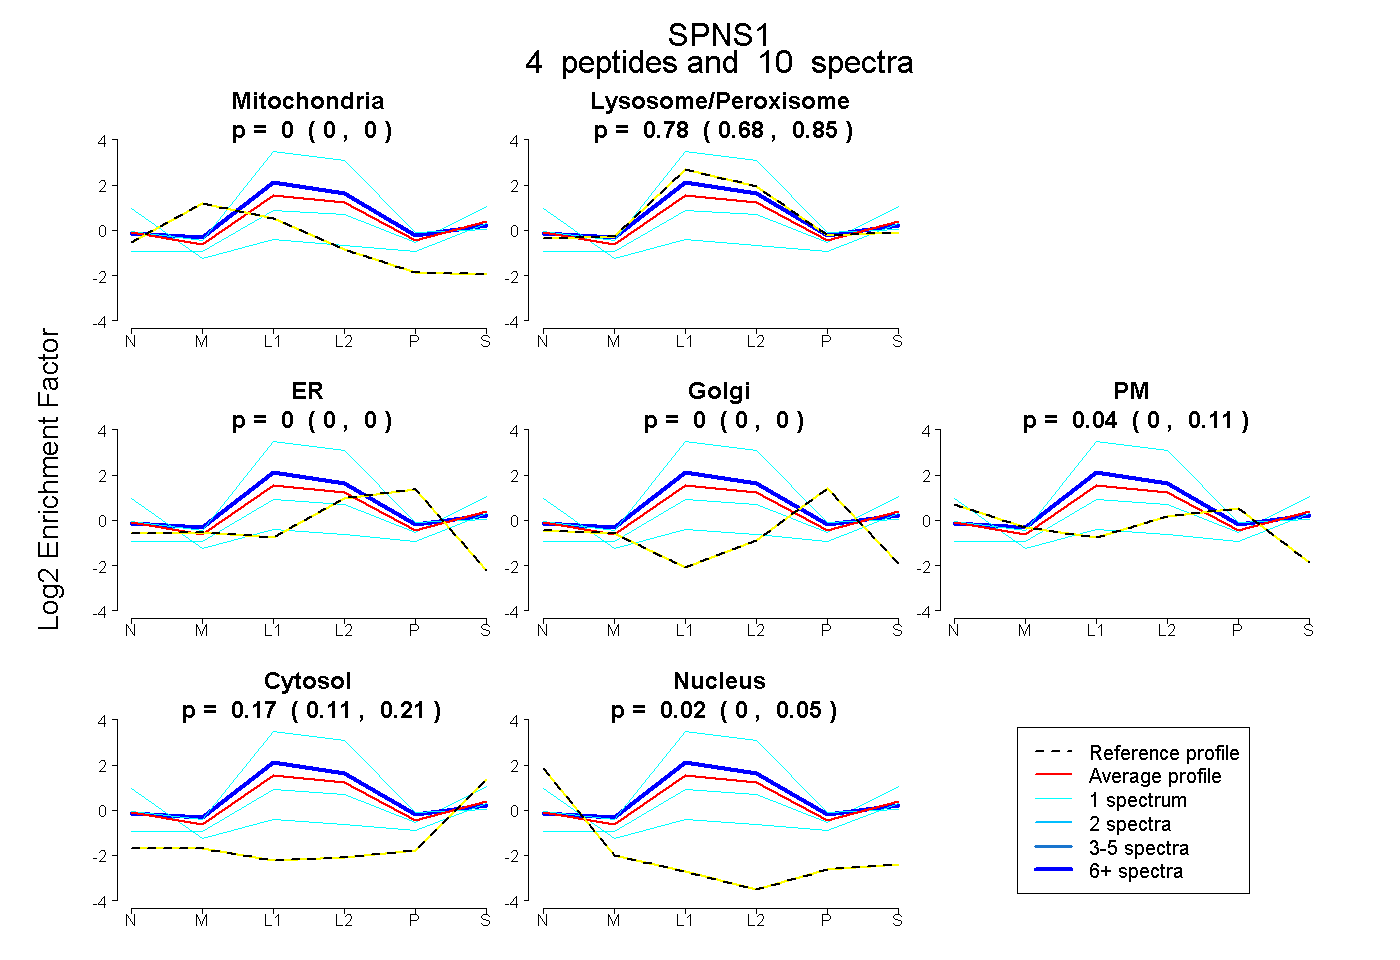
0.000 | 0.000
0.677 | 0.848
0.000 | 0.000
0.000 | 0.000
0.000 | 0.105
0.111 | 0.207
0.000 | 0.053