 7
7peptides
spectra
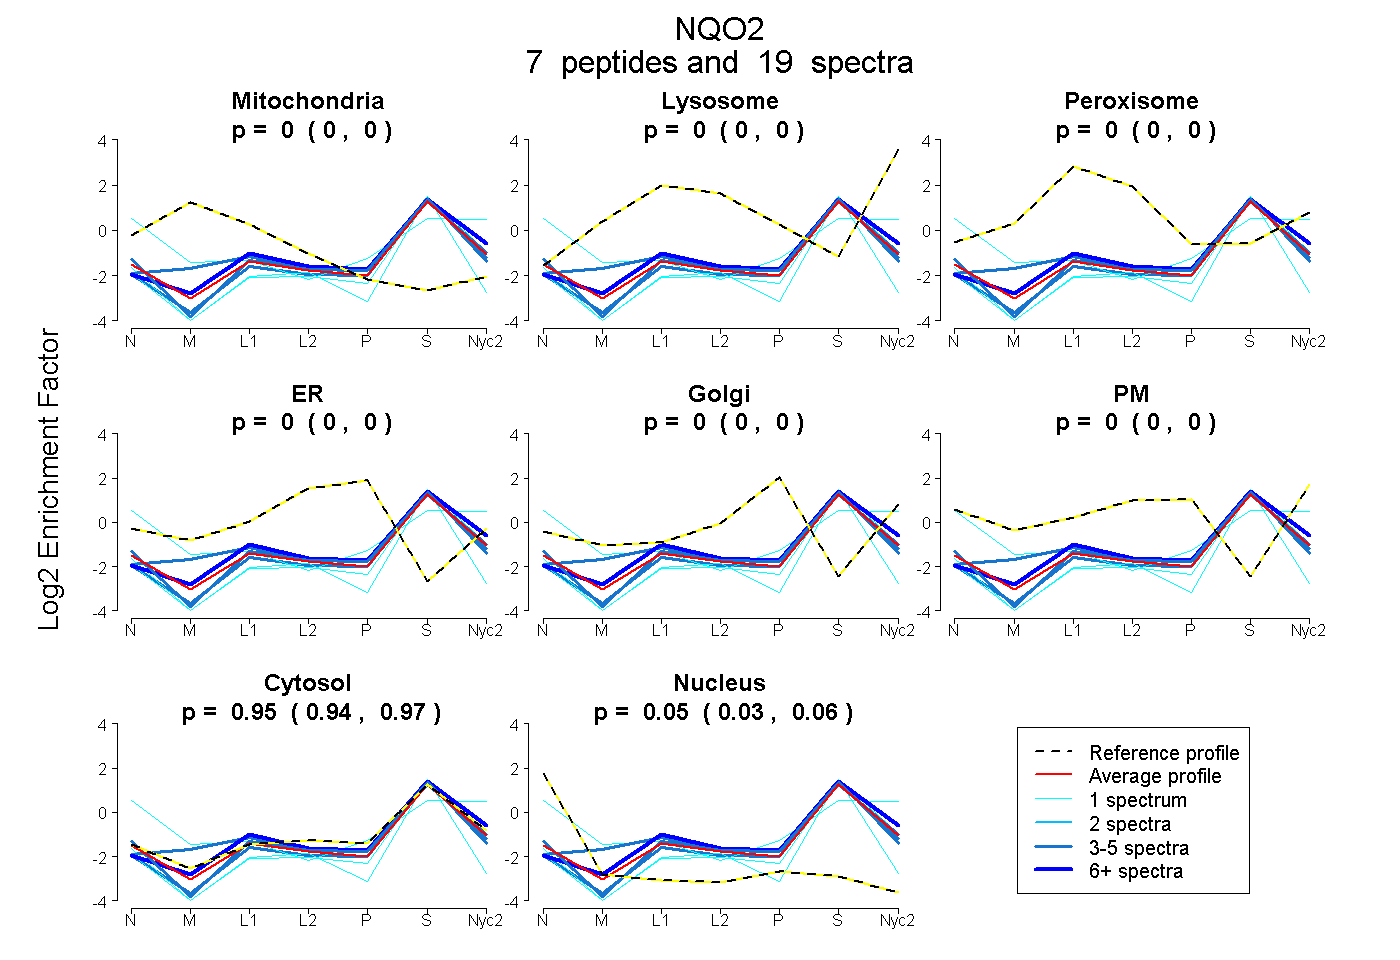
0.000 | 0.000
0.000 | 0.000
0.000 | 0.000
0.000 | 0.000
0.000 | 0.000
0.000 | 0.000
0.938 | 0.966
0.031 | 0.060
| Plot | Mito | Lyso | Perox | ER | Golgi | PM | Cytosol | Nucleus | |||||
| Expt A |
7 peptides |
19 spectra |
|
0.000 0.000 | 0.000 |
0.000 0.000 | 0.000 |
0.000 0.000 | 0.000 |
0.000 0.000 | 0.000 |
0.000 0.000 | 0.000 |
0.000 0.000 | 0.000 |
0.953 0.938 | 0.966 |
0.047 0.031 | 0.060 |
| 3 spectra, ALTSDILEEQR | 0.000 | 0.000 | 0.000 | 0.000 | 0.000 | 0.000 | 0.962 | 0.038 | ||
| 1 spectrum, NDVTGALSNPEVFK | 0.000 | 0.111 | 0.000 | 0.000 | 0.000 | 0.125 | 0.582 | 0.182 | ||
| 3 spectra, YGIEAYEAYK | 0.000 | 0.000 | 0.000 | 0.000 | 0.000 | 0.000 | 0.942 | 0.058 | ||
| 1 spectrum, QGCTVTVSDLYTMNFEPR | 0.000 | 0.000 | 0.000 | 0.000 | 0.000 | 0.000 | 0.838 | 0.162 | ||
| 4 spectra, VLLVYAHQEPK | 0.097 | 0.000 | 0.000 | 0.000 | 0.000 | 0.000 | 0.903 | 0.000 | ||
| 6 spectra, VMLASWVQR | 0.000 | 0.000 | 0.000 | 0.000 | 0.000 | 0.000 | 1.000 | 0.000 | ||
| 1 spectrum, VLAPQISFGPEVSSEEQR | 0.000 | 0.000 | 0.000 | 0.000 | 0.000 | 0.000 | 0.922 | 0.078 |
| Plot | Mito | Lyso or Perox | ER | Golgi | PM | Cytosol | Nucleus | ||||||
| Expt B |
3 peptides |
6 spectra |
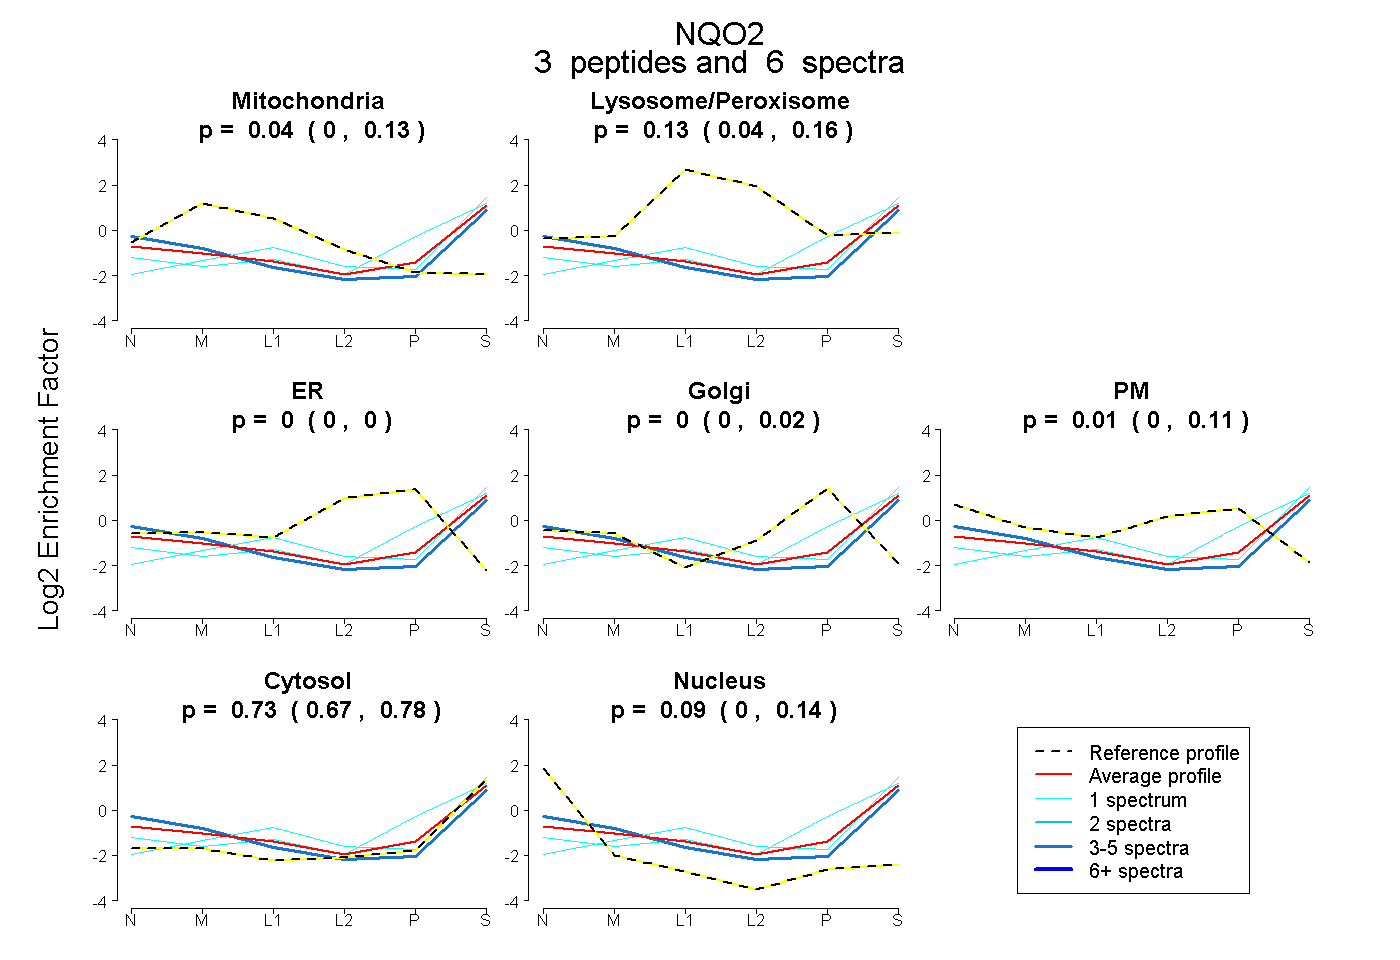 |
0.040 0.000 | 0.132 |
0.127 0.041 | 0.163 |
0.000 0.000 | 0.000 |
0.000 0.000 | 0.021 |
0.013 0.000 | 0.115 |
0.734 0.674 | 0.785 |
0.086 0.000 | 0.139 |
|||
| Plot | Lyso | Other | |||||||||||
| Expt C |
4 peptides |
8 spectra |
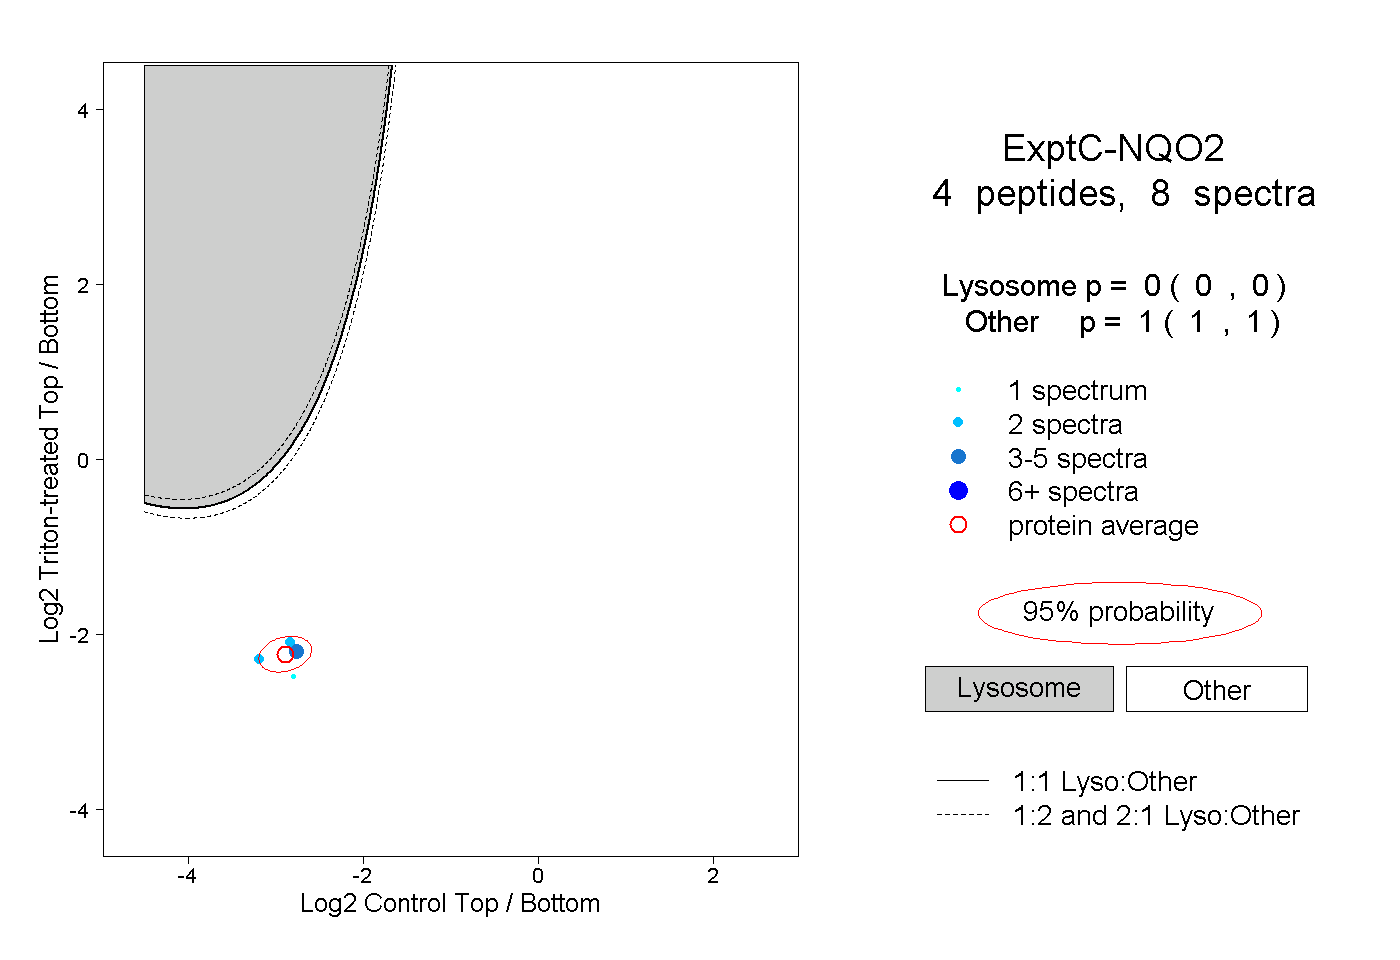 |
0.000 0.000 | 0.000 |
1.000 1.000 | 1.000 |