 6
6peptides
spectra
0.000 | 0.045
0.075 | 0.099
0.000 | 0.000
0.000 | 0.000
0.000 | 0.000
0.000 | 0.000
0.857 | 0.910
0.000 | 0.000
| Plot | Mito | Lyso | Perox | ER | Golgi | PM | Cytosol | Nucleus | |||||
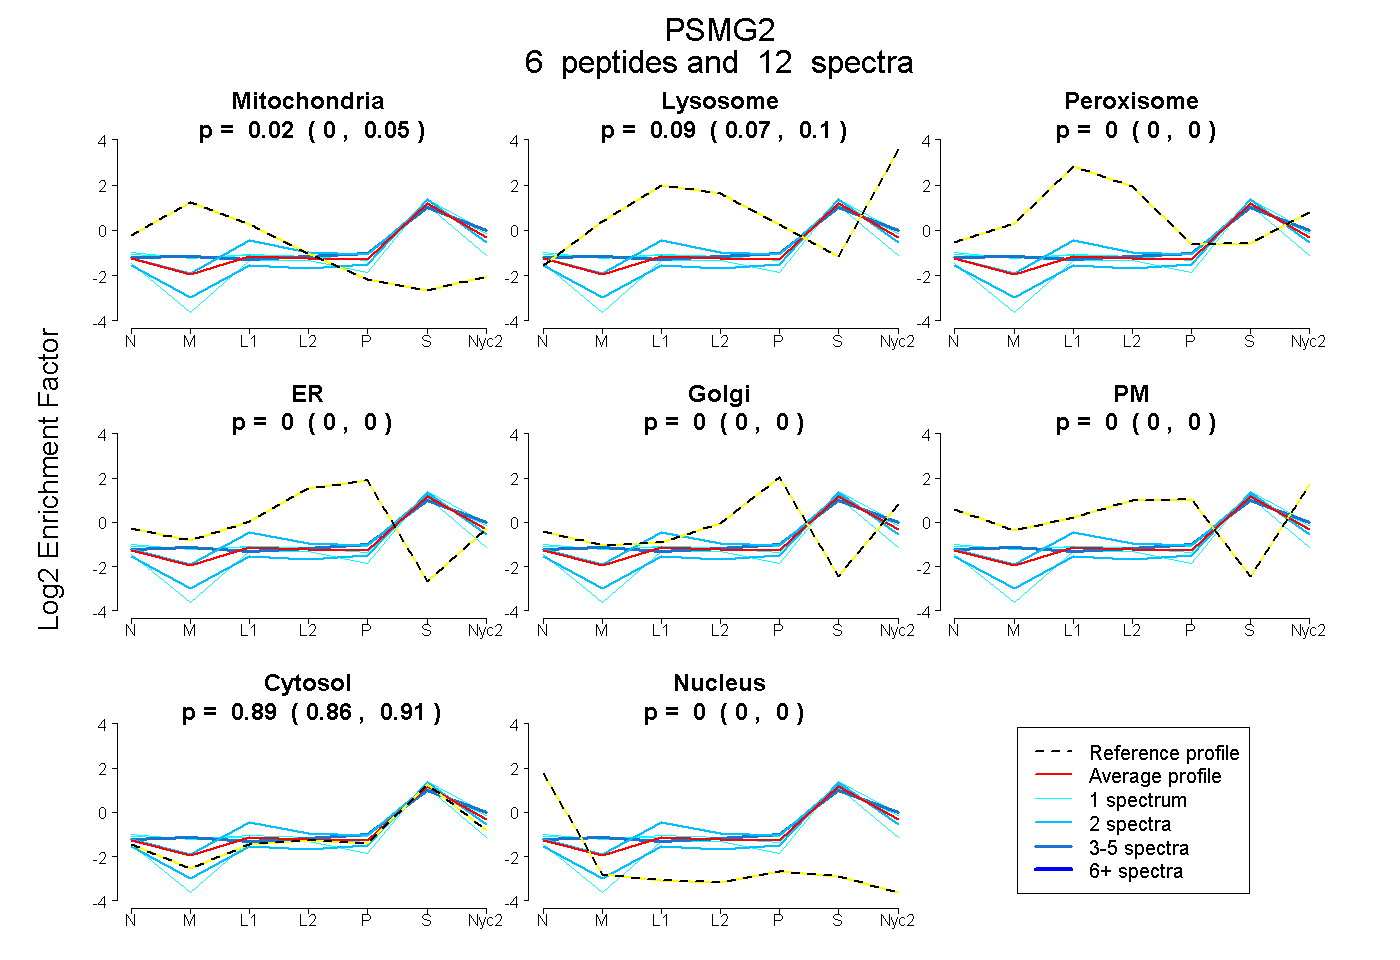
| Expt A |
6 peptides |
12 spectra |
|
0.024 0.000 | 0.045 |
0.088 0.075 | 0.099 |
0.000 0.000 | 0.000 |
0.000 0.000 | 0.000 |
0.000 0.000 | 0.000 |
0.000 0.000 | 0.000 |
0.888 0.857 | 0.910 |
0.000 0.000 | 0.000 |
| 2 spectra, TDVQLR | 0.000 | 0.049 | 0.141 | 0.000 | 0.000 | 0.000 | 0.810 | 0.000 | ||
| 1 spectrum, LVVLQLR | 0.000 | 0.000 | 0.000 | 0.000 | 0.000 | 0.000 | 1.000 | 0.000 | ||
| 1 spectrum, IPGGGITK | 0.081 | 0.135 | 0.000 | 0.000 | 0.000 | 0.003 | 0.780 | 0.000 | ||
| 2 spectra, YLLTPCLQK | 0.000 | 0.000 | 0.000 | 0.000 | 0.000 | 0.000 | 1.000 | 0.000 | ||
| 5 spectra, SLNWLEMEK | 0.067 | 0.138 | 0.000 | 0.000 | 0.017 | 0.000 | 0.779 | 0.000 | ||
| 1 spectrum, CIPEMSDSEFCIR | 0.168 | 0.000 | 0.035 | 0.000 | 0.000 | 0.000 | 0.797 | 0.000 |
| Plot | Mito | Lyso or Perox | ER | Golgi | PM | Cytosol | Nucleus | ||||||
| Expt B |
1 peptide |
2 spectra |
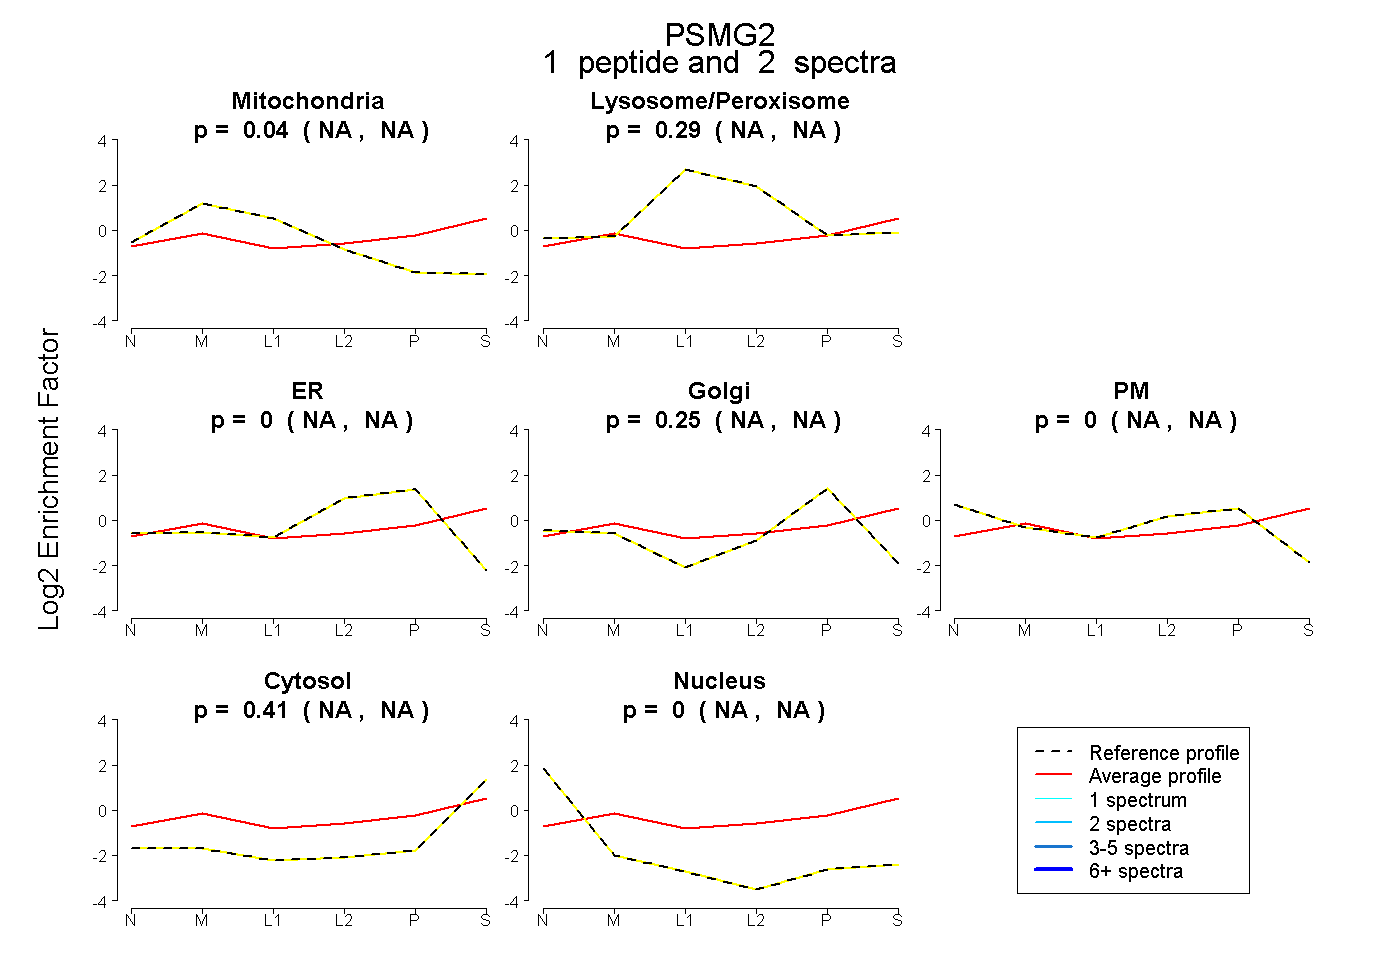 |
0.041 NA | NA |
0.292 NA | NA |
0.000 NA | NA |
0.251 NA | NA |
0.003 NA | NA |
0.413 NA | NA |
0.000 NA | NA |
|||
| Plot | Lyso | Other | |||||||||||
| Expt C |
1 peptide |
2 spectra |
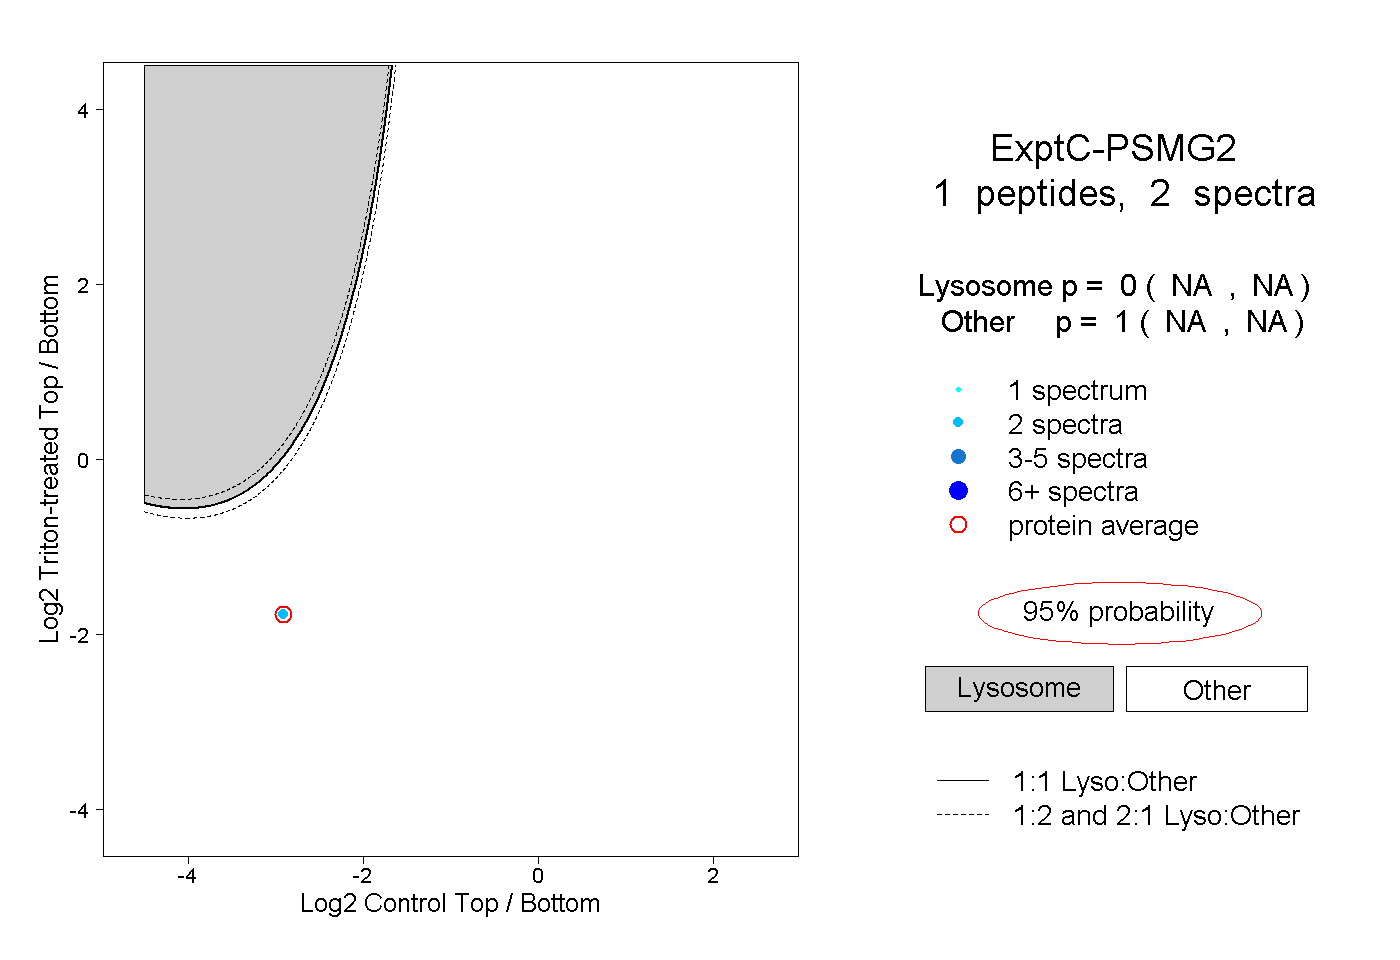 |
0.000 NA | NA |
1.000 NA | NA |