 3
3peptides
spectra
0.000 | 0.000
0.000 | 0.000
0.000 | 0.000
0.000 | 0.088
0.106 | 0.298
0.000 | 0.071
0.159 | 0.244
0.496 | 0.574
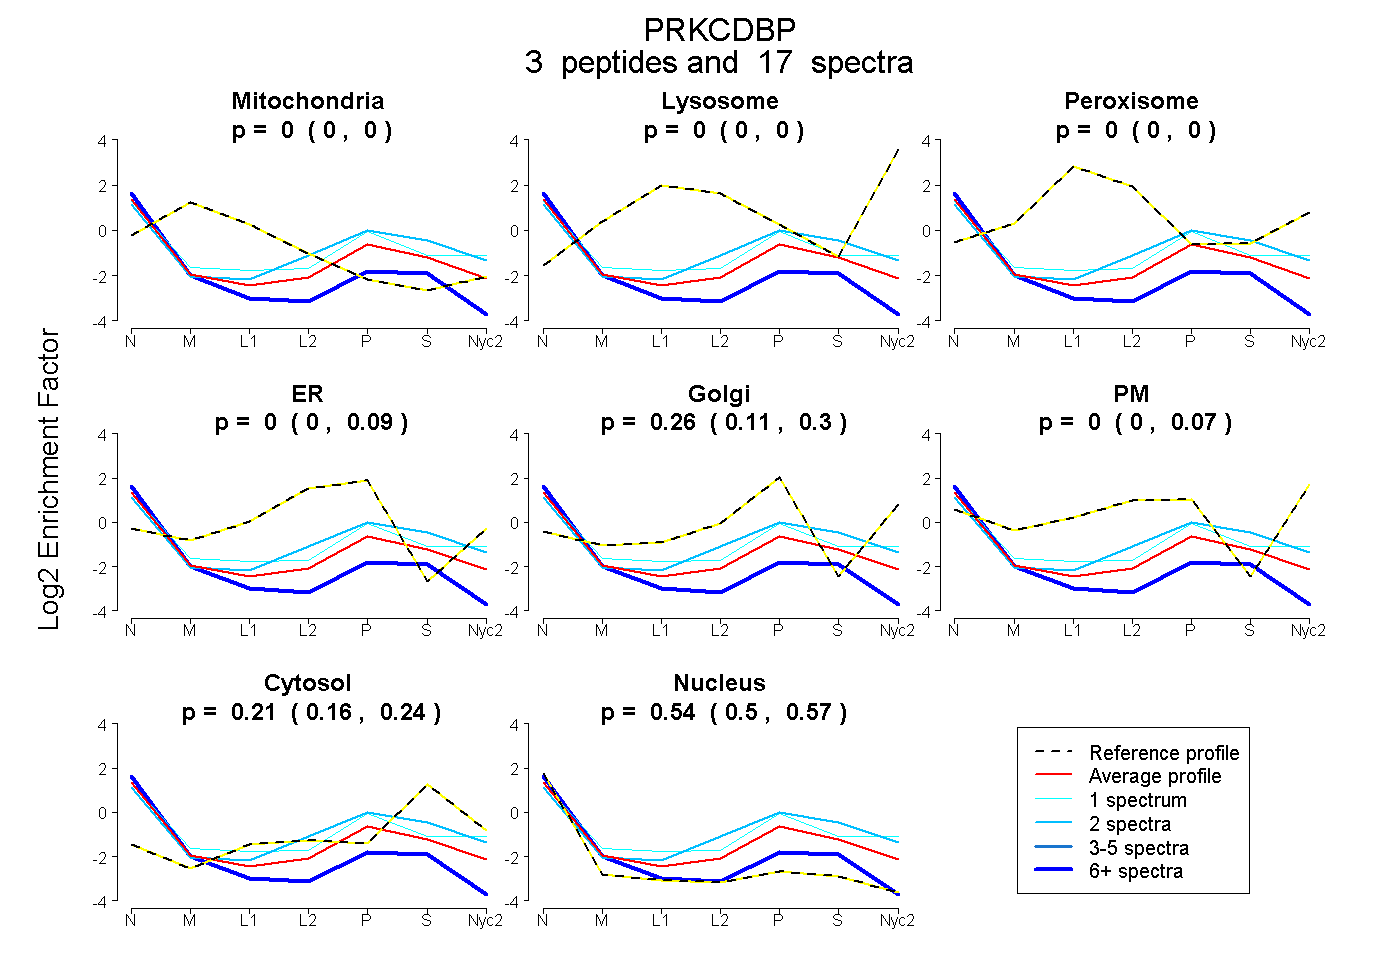
| Plot | Mito | Lyso | Perox | ER | Golgi | PM | Cytosol | Nucleus | |||||
| Expt A |
3 peptides |
17 spectra |
|
0.000 0.000 | 0.000 |
0.000 0.000 | 0.000 |
0.000 0.000 | 0.000 |
0.000 0.000 | 0.088 |
0.257 0.106 | 0.298 |
0.000 0.000 | 0.071 |
0.205 0.159 | 0.244 |
0.538 0.496 | 0.574 |
| 14 spectra, AFSSR | 0.036 | 0.000 | 0.000 | 0.000 | 0.015 | 0.000 | 0.099 | 0.849 | ||
| 1 spectrum, IQSGLGALSR | 0.000 | 0.000 | 0.000 | 0.000 | 0.255 | 0.157 | 0.206 | 0.381 | ||
| 2 spectra, LHVLLFK | 0.000 | 0.000 | 0.000 | 0.036 | 0.258 | 0.049 | 0.339 | 0.318 |