 2
2peptides
spectra
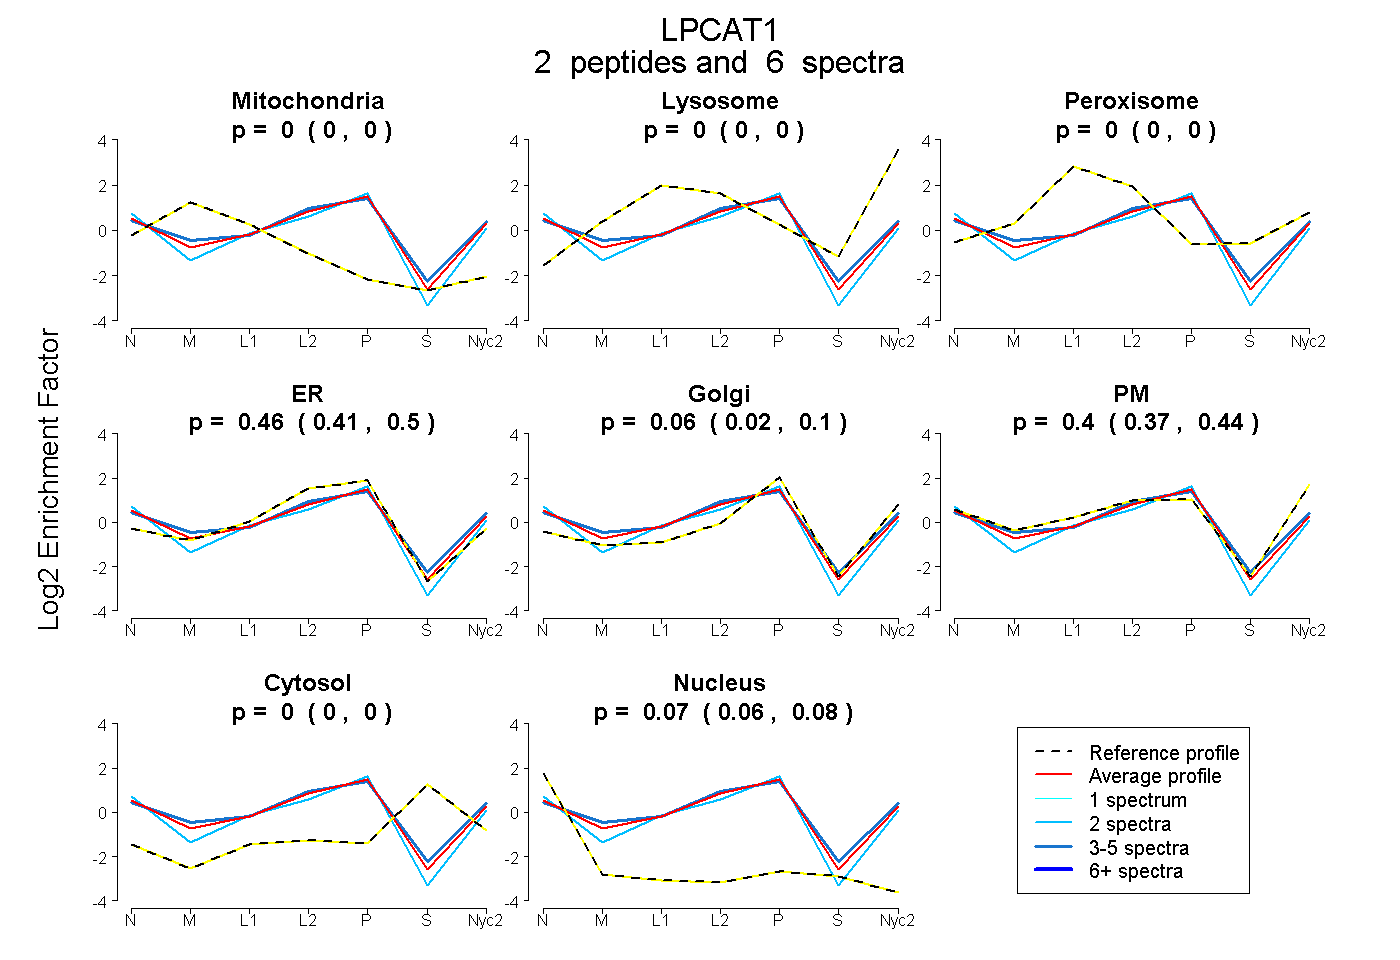
0.000 | 0.000
0.000 | 0.000
0.000 | 0.000
0.414 | 0.497
0.024 | 0.096
0.369 | 0.436
0.000 | 0.000
0.064 | 0.080
3peptides
spectra
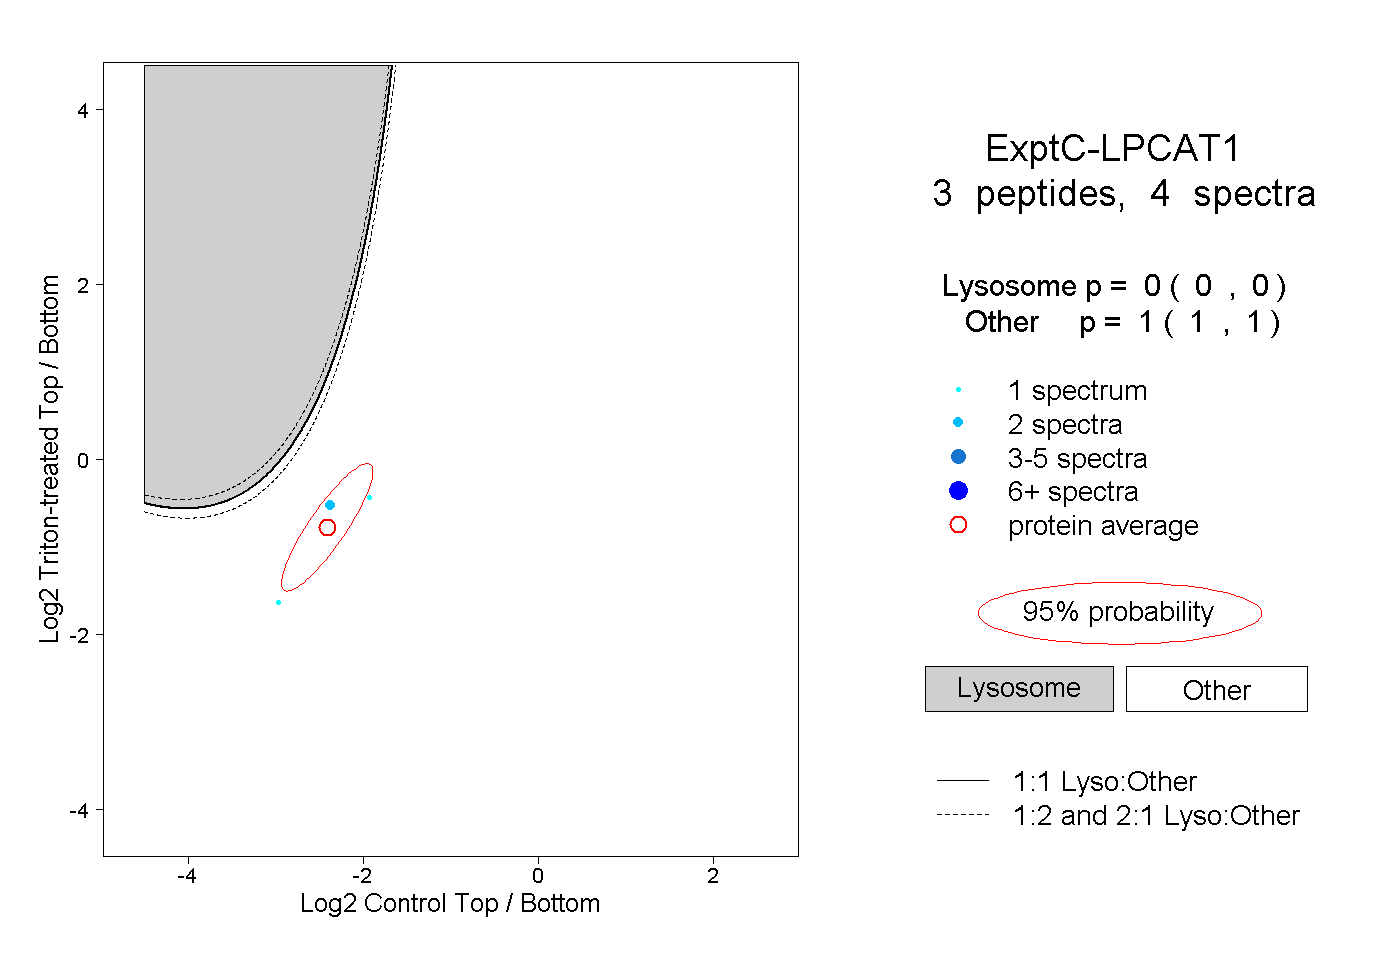
0.000 | 0.000
1.000 | 1.000
| Plot | Mito | Lyso | Perox | ER | Golgi | PM | Cytosol | Nucleus | |||||
| Expt A |
2 peptides |
6 spectra |
|
0.000 0.000 | 0.000 |
0.000 0.000 | 0.000 |
0.000 0.000 | 0.000 |
0.460 0.414 | 0.497 |
0.063 0.024 | 0.096 |
0.405 0.369 | 0.436 |
0.000 0.000 | 0.000 |
0.073 0.064 | 0.080 |
||
| Plot | Lyso | Other | |||||||||||
| Expt C |
3 peptides |
4 spectra |
|
0.000 0.000 | 0.000 |
1.000 1.000 | 1.000 |