 5
5peptides
spectra
0.000 | 0.000
0.000 | 0.000
0.000 | 0.000
0.212 | 0.230
0.000 | 0.000
0.000 | 0.000
0.595 | 0.621
0.152 | 0.184
| Plot | Mito | Lyso | Perox | ER | Golgi | PM | Cytosol | Nucleus | |||||
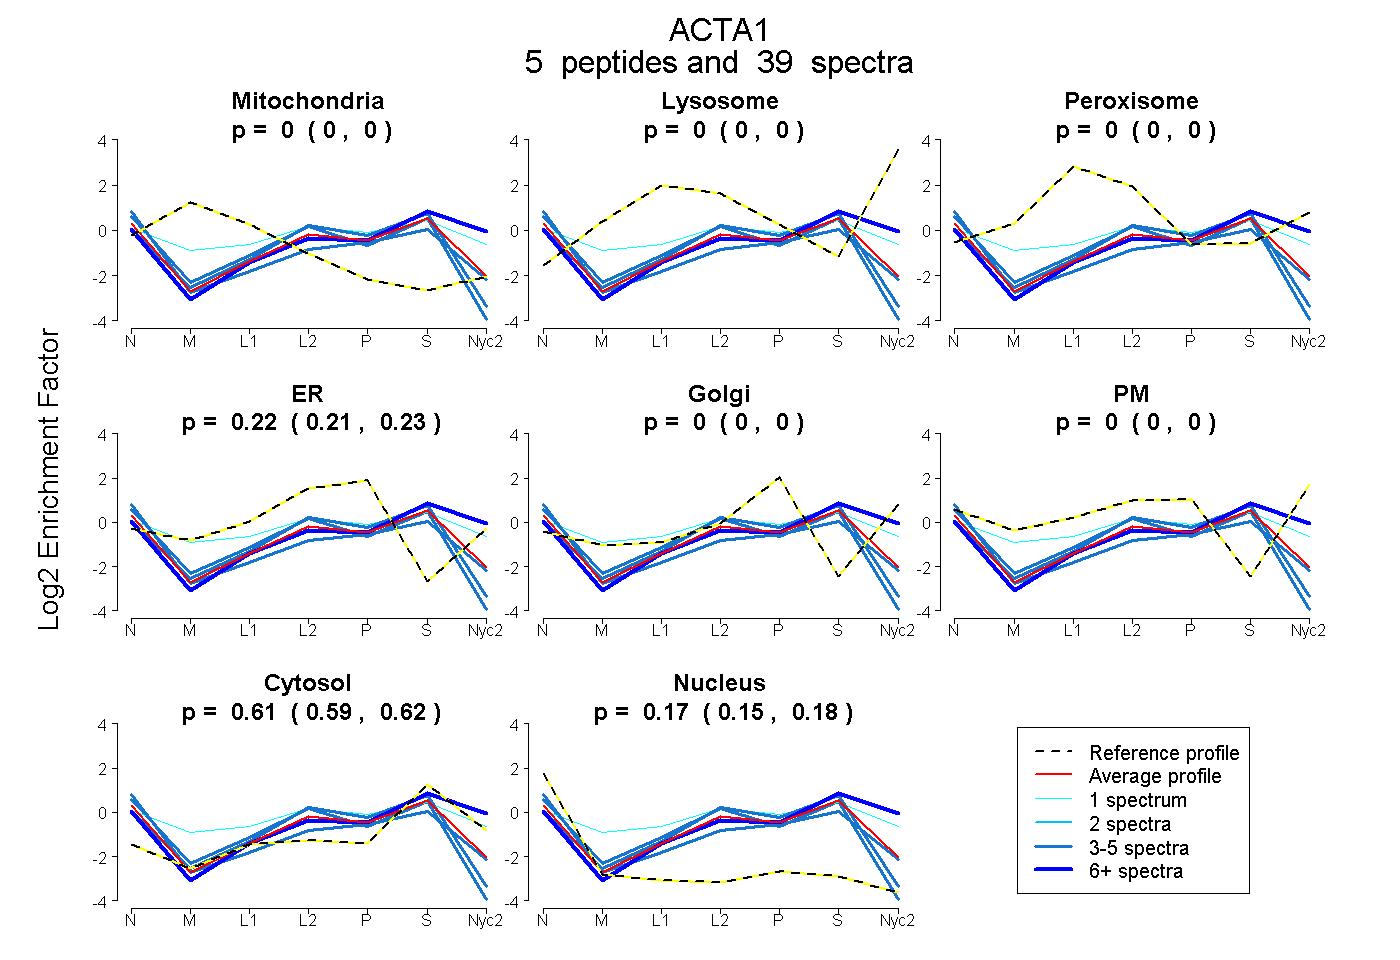
| Expt A |
5 peptides |
39 spectra |
|
0.000 0.000 | 0.000 |
0.000 0.000 | 0.000 |
0.000 0.000 | 0.000 |
0.222 0.212 | 0.230 |
0.000 0.000 | 0.000 |
0.000 0.000 | 0.000 |
0.609 0.595 | 0.621 |
0.169 0.152 | 0.184 |
| 3 spectra, DLTDYLMK | 0.000 | 0.000 | 0.056 | 0.176 | 0.000 | 0.000 | 0.455 | 0.313 | ||
| 3 spectra, HQGVMVGMGQK | 0.000 | 0.000 | 0.000 | 0.230 | 0.000 | 0.000 | 0.587 | 0.183 | ||
| 3 spectra, QEYDEAGPSIVHR | 0.000 | 0.000 | 0.000 | 0.191 | 0.000 | 0.000 | 0.496 | 0.312 | ||
| 1 spectrum, EITALAPSTMK | 0.000 | 0.000 | 0.181 | 0.176 | 0.000 | 0.105 | 0.498 | 0.040 | ||
| 29 spectra, YPIEHGIITNWDDMEK | 0.000 | 0.000 | 0.000 | 0.000 | 0.000 | 0.225 | 0.762 | 0.012 |
| Plot | Mito | Lyso or Perox | ER | Golgi | PM | Cytosol | Nucleus | ||||||
| Expt B |
2 peptides |
7 spectra |
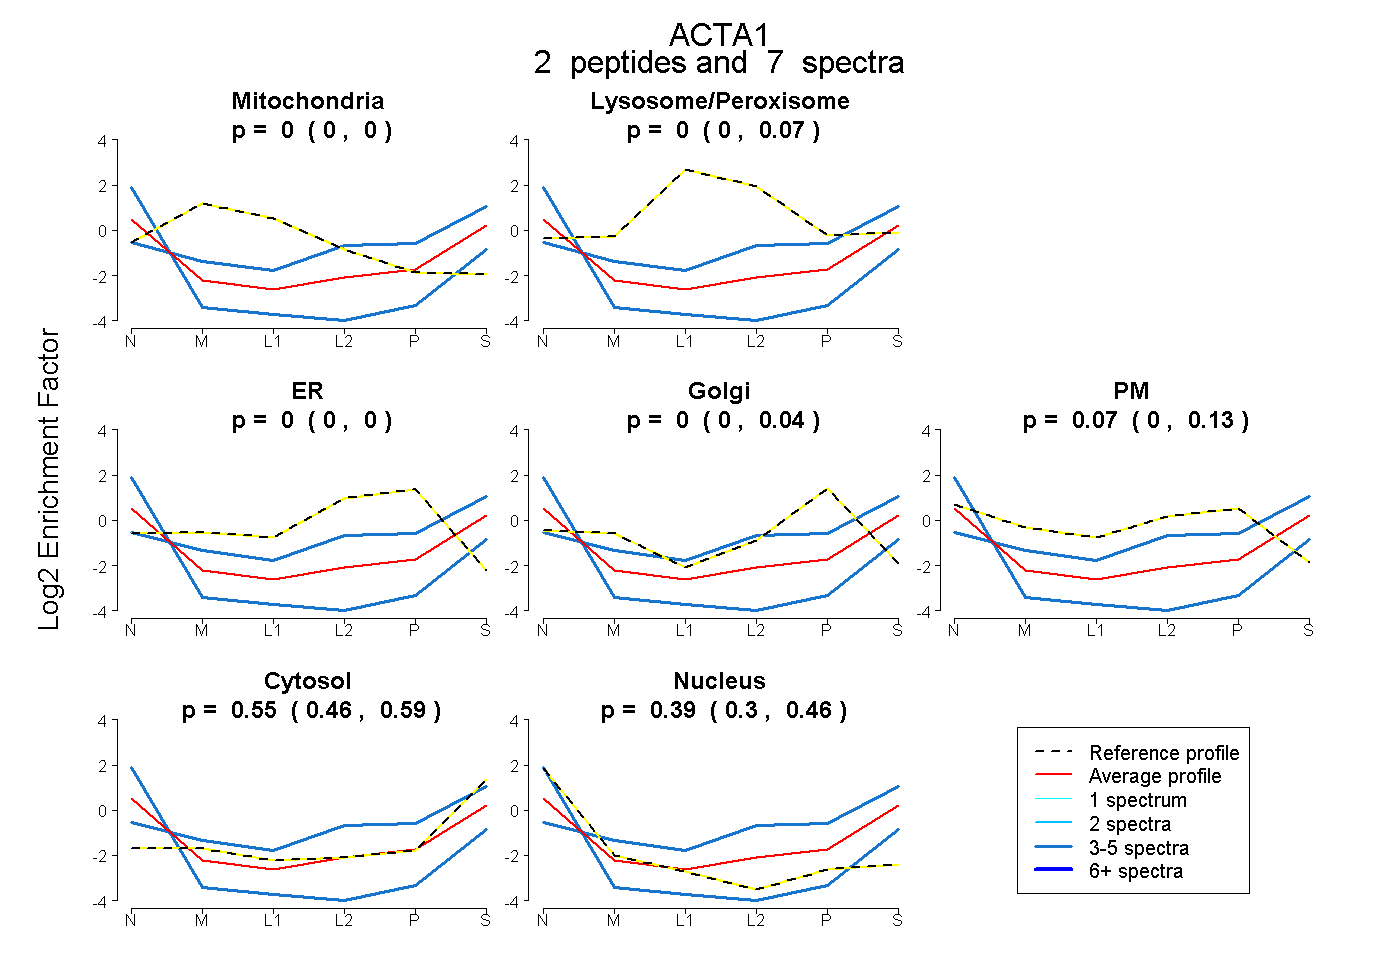 |
0.000 0.000 | 0.000 |
0.000 0.000 | 0.066 |
0.000 0.000 | 0.000 |
0.000 0.000 | 0.040 |
0.069 0.000 | 0.132 |
0.546 0.464 | 0.592 |
0.385 0.304 | 0.461 |
|||
| Plot | Lyso | Other | |||||||||||
| Expt C |
7 peptides |
124 spectra |
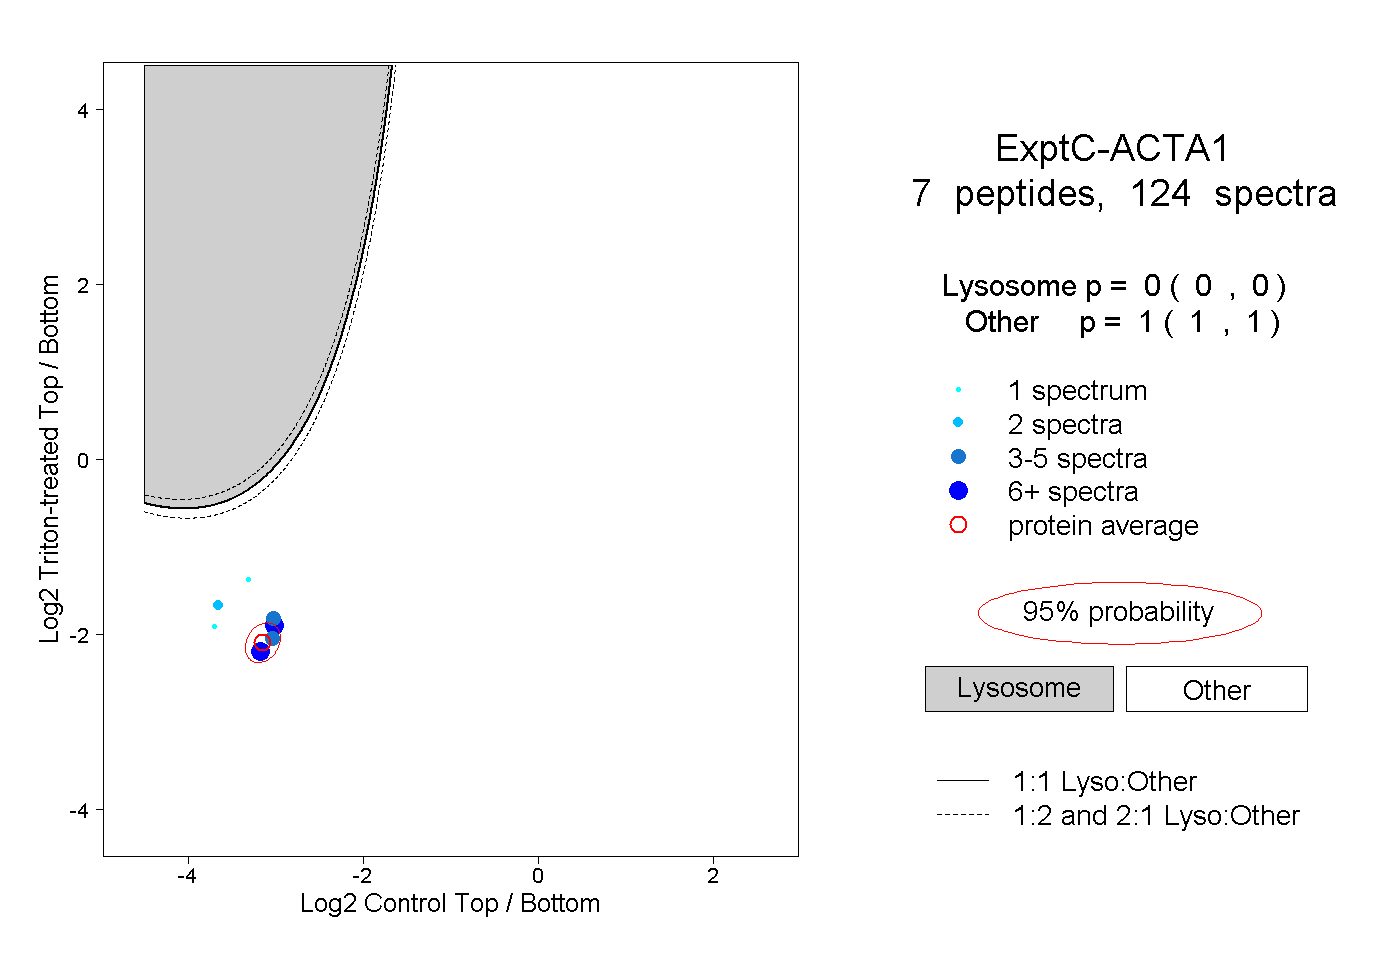 |
0.000 0.000 | 0.000 |
1.000 1.000 | 1.000 |
||||||||
| Plot | Lyso | Other | |||||||||||
| Expt D |
5 peptides |
5 spectra |
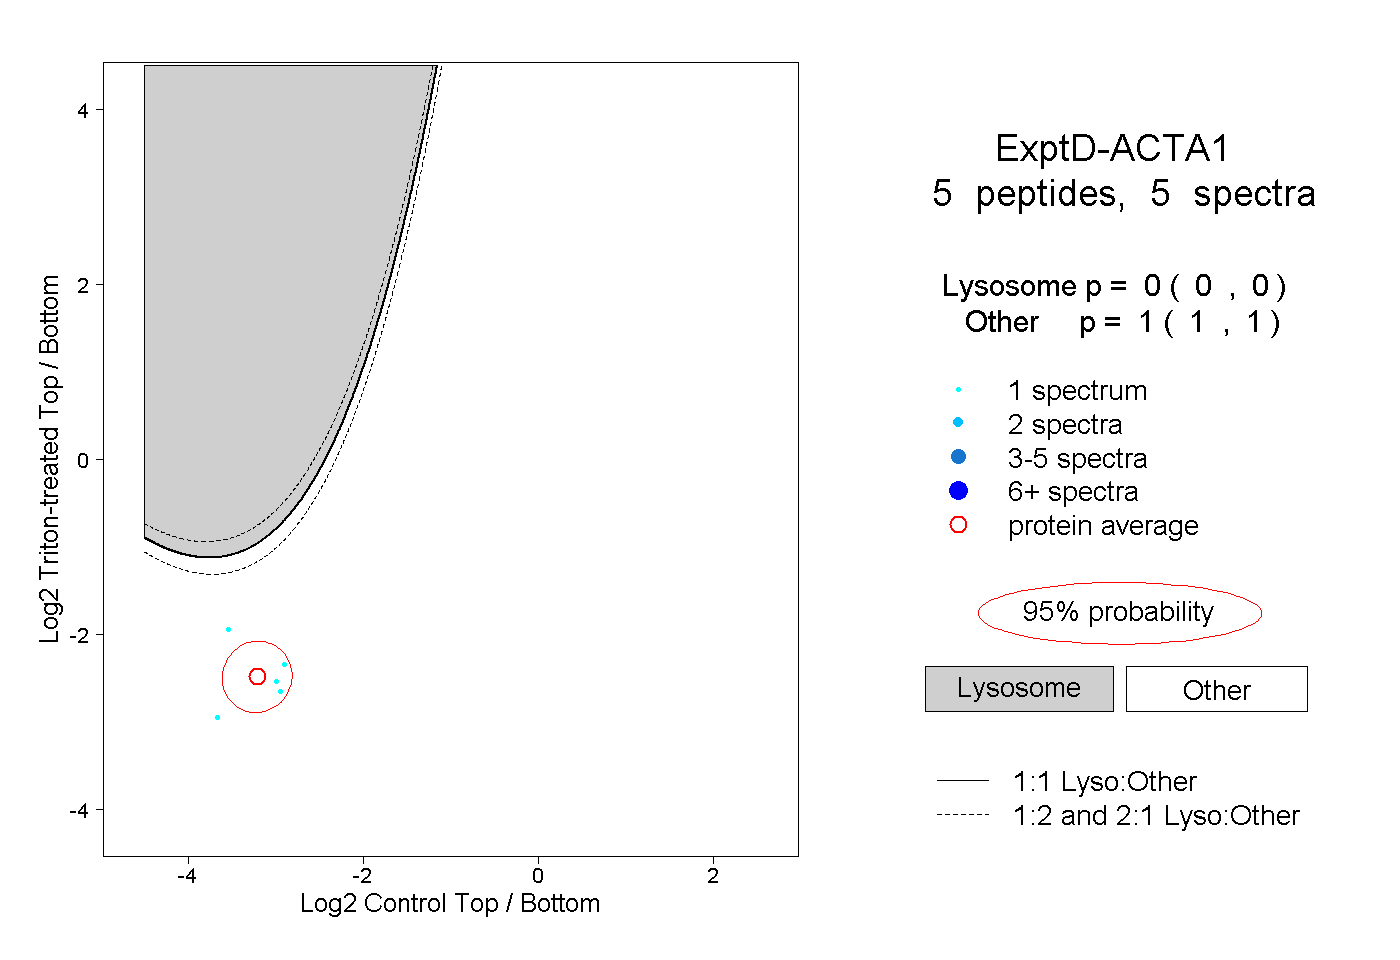 |
0.000 0.000 | 0.000 |
1.000 1.000 | 1.000 |