 4
4peptides
spectra
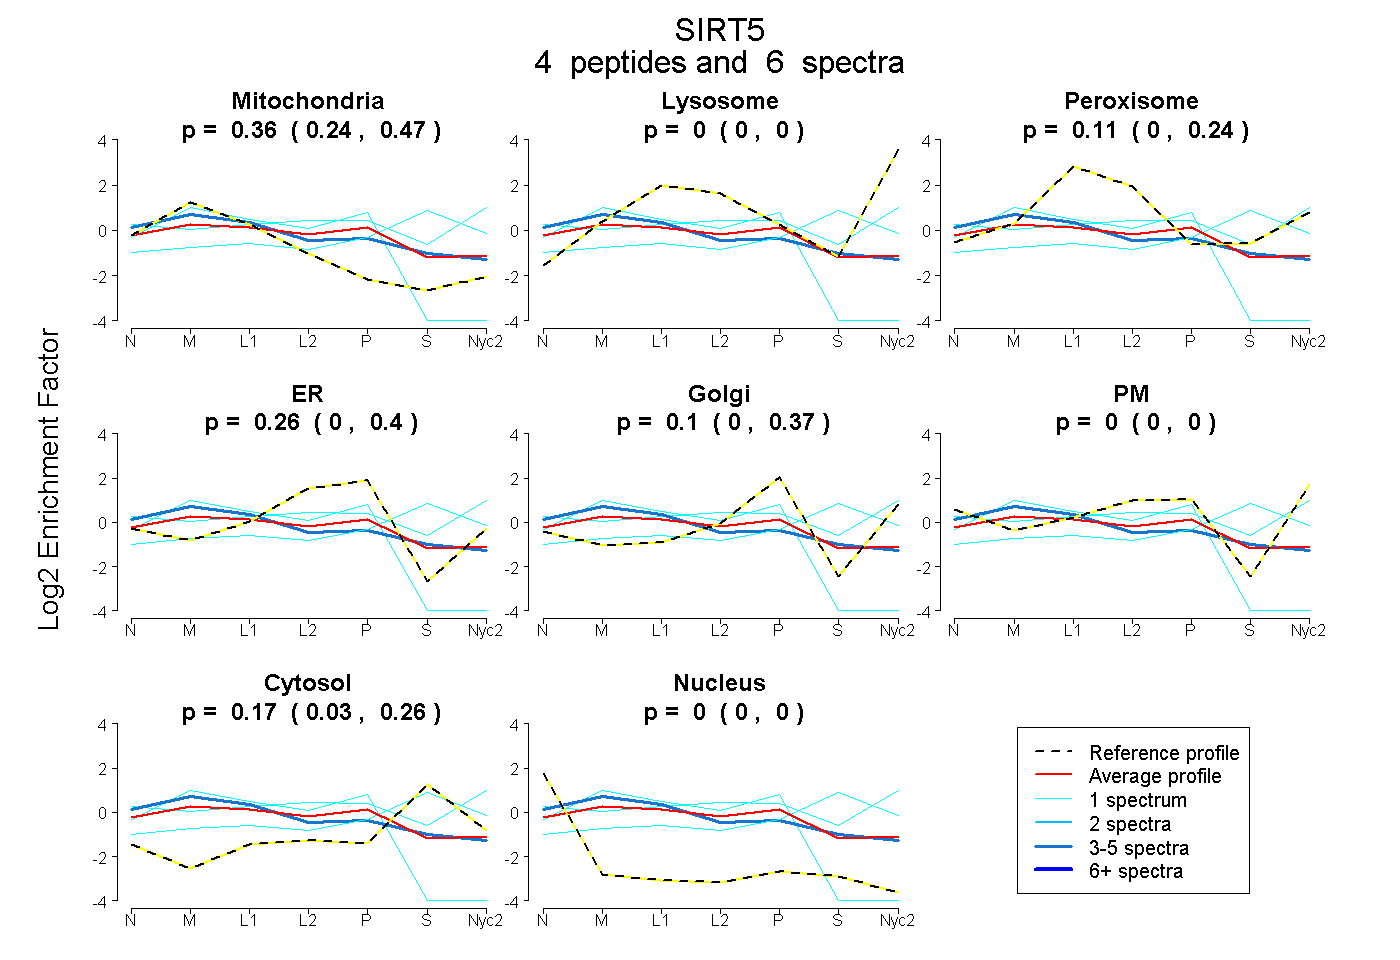
0.238 | 0.467
0.000 | 0.000
0.000 | 0.239
0.000 | 0.404
0.000 | 0.366
0.000 | 0.000
0.033 | 0.265
0.000 | 0.000
1peptide
spectrum
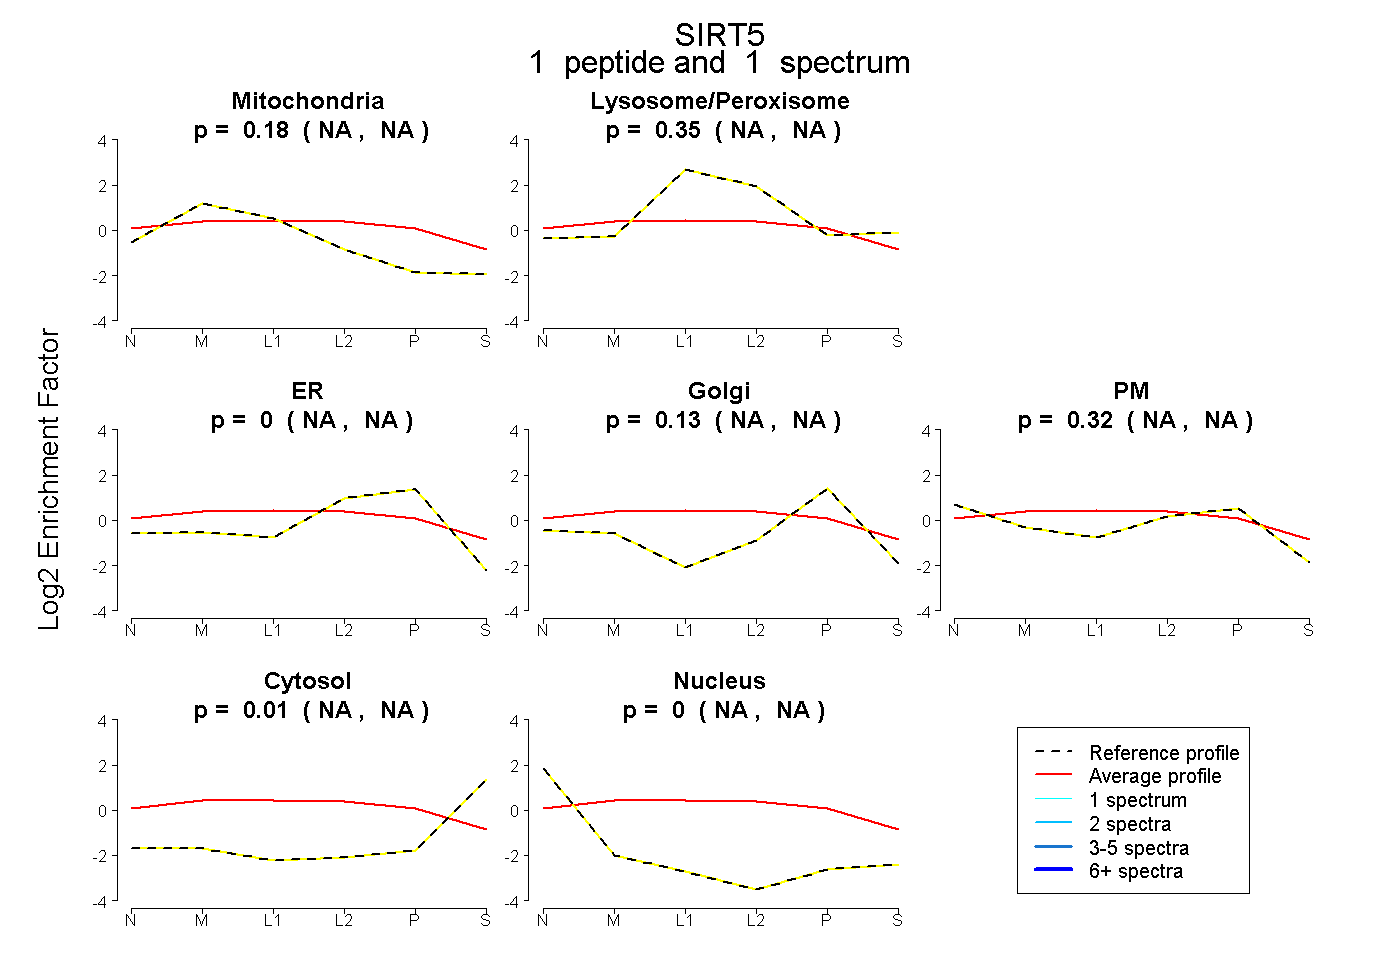
NA | NA
NA | NA
NA | NA
NA | NA
NA | NA
NA | NA
NA | NA
6peptides
spectra
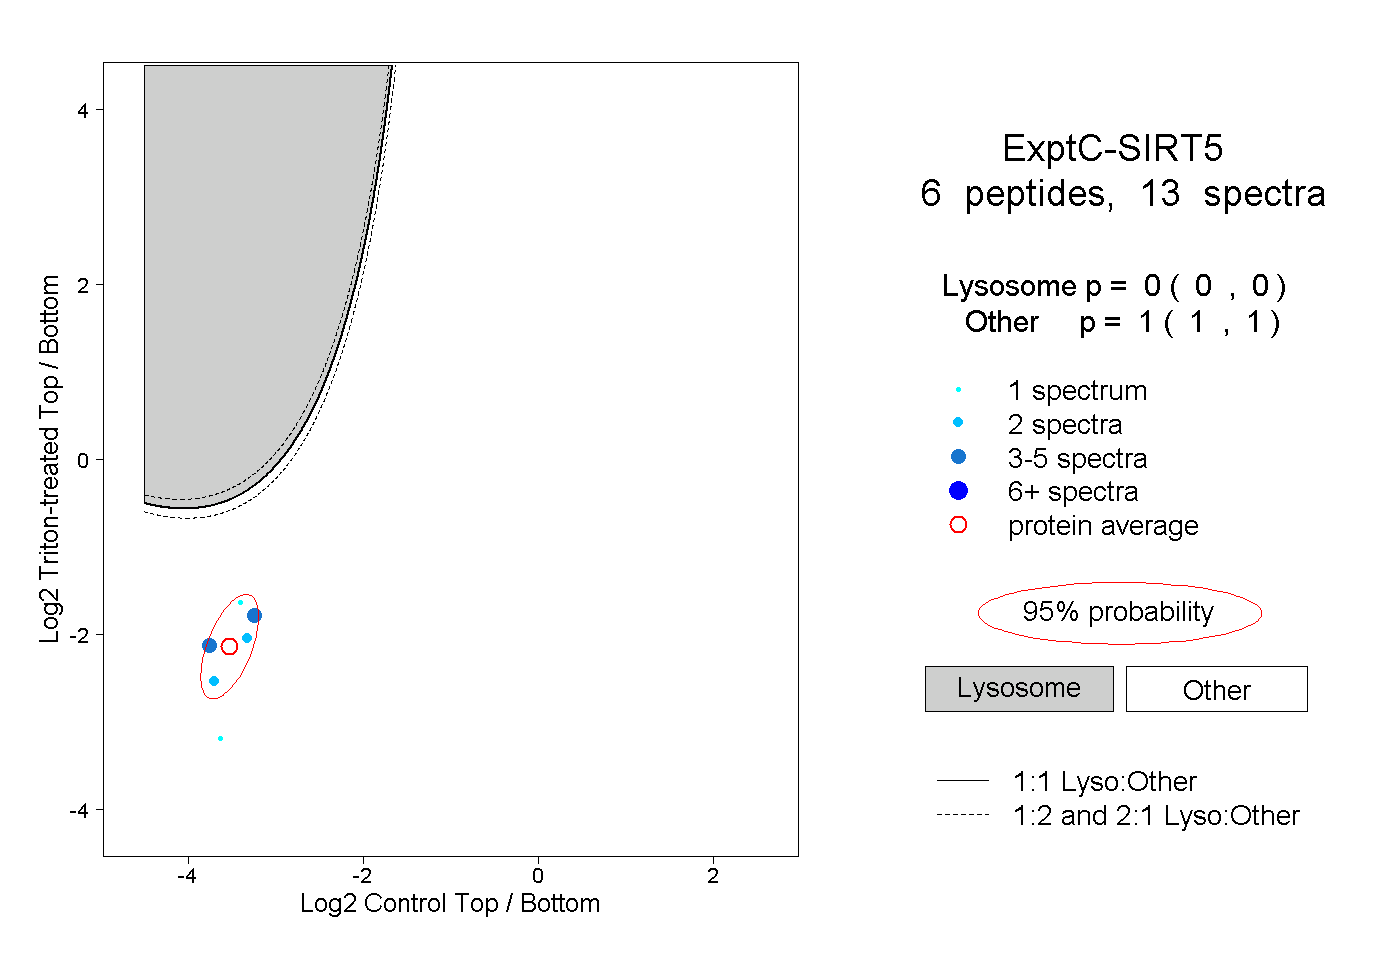
0.000 | 0.000
1.000 | 1.000
1peptide
spectra
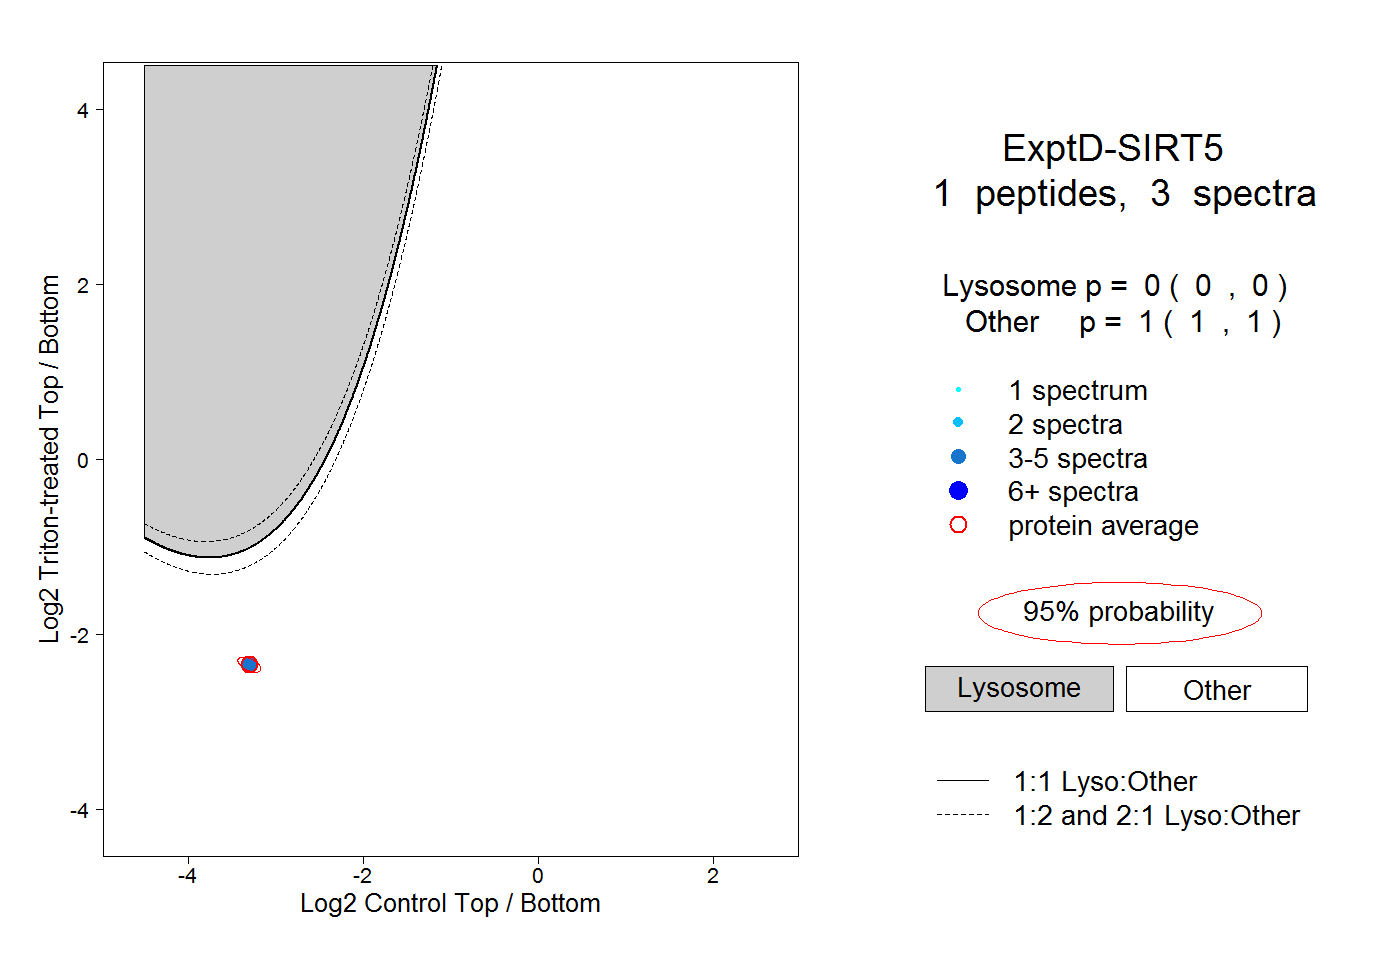
0.000 | 0.000
1.000 | 1.000