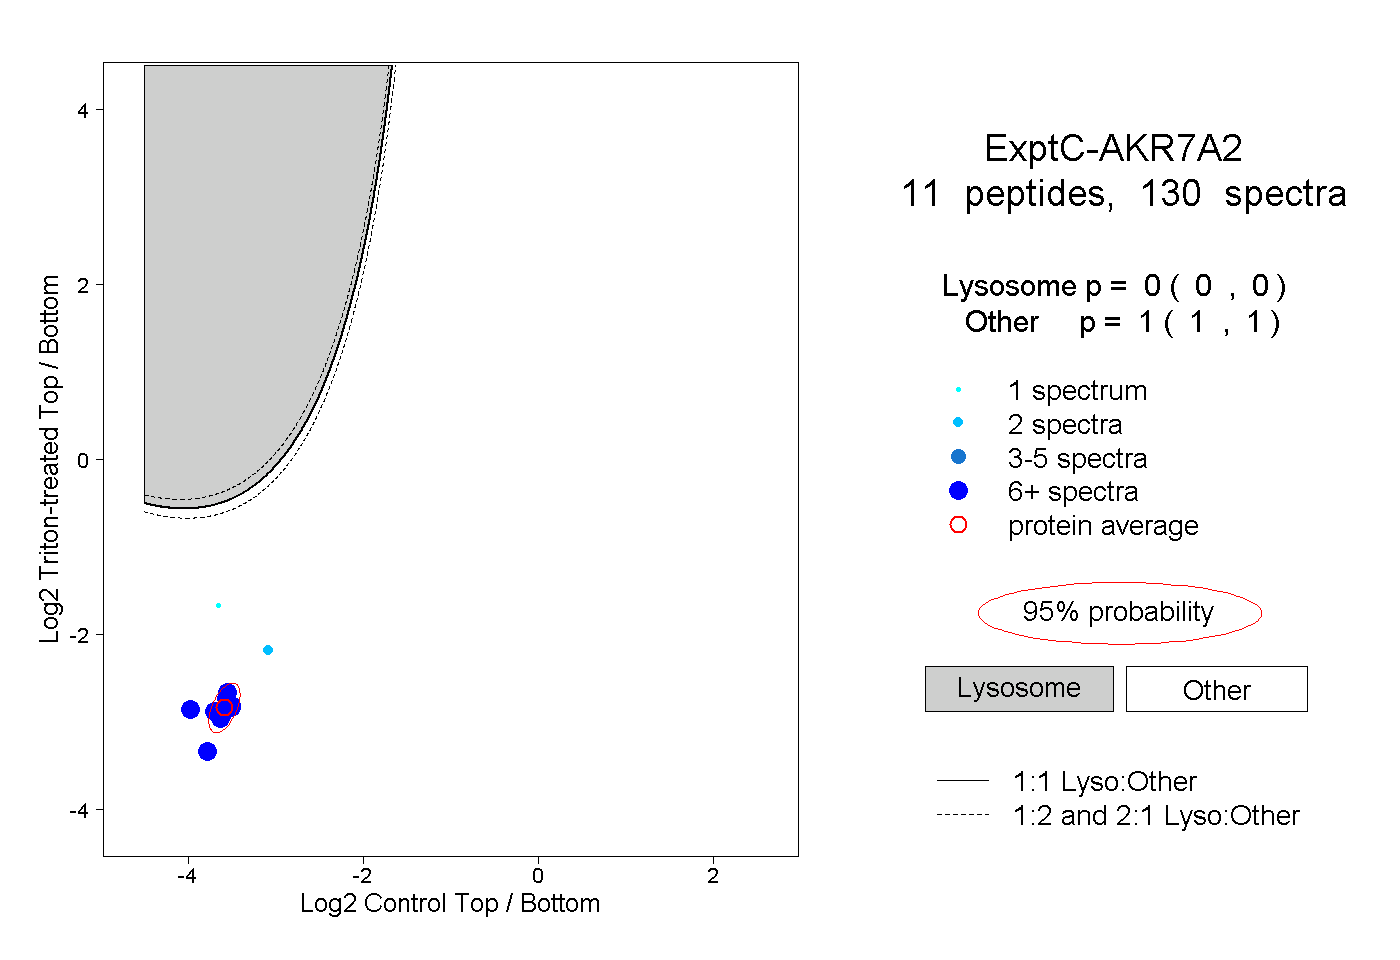
11
11peptides
spectra
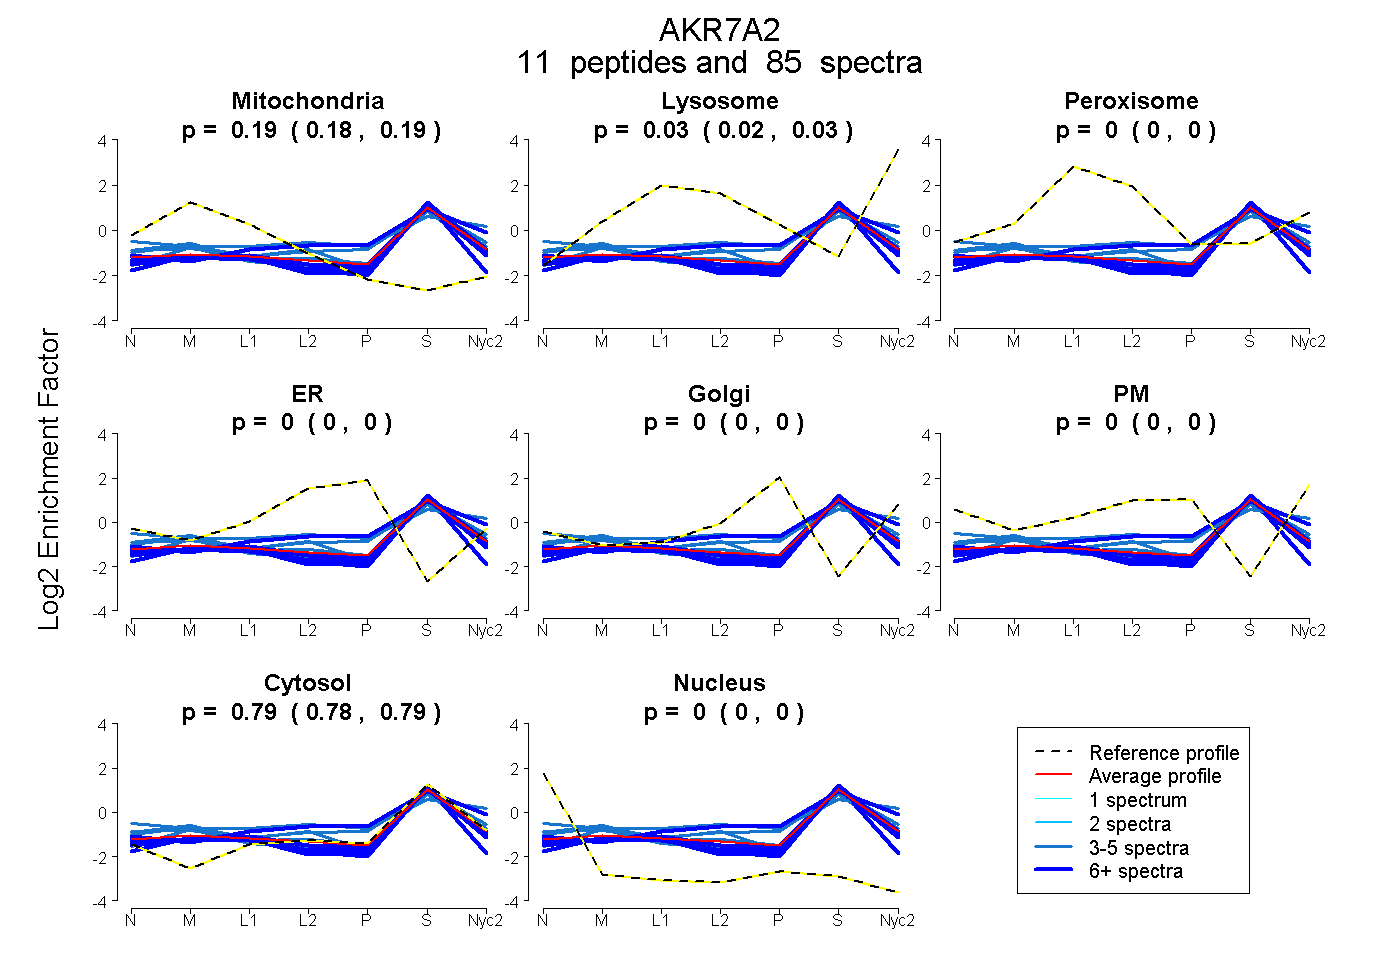
0.183 | 0.191
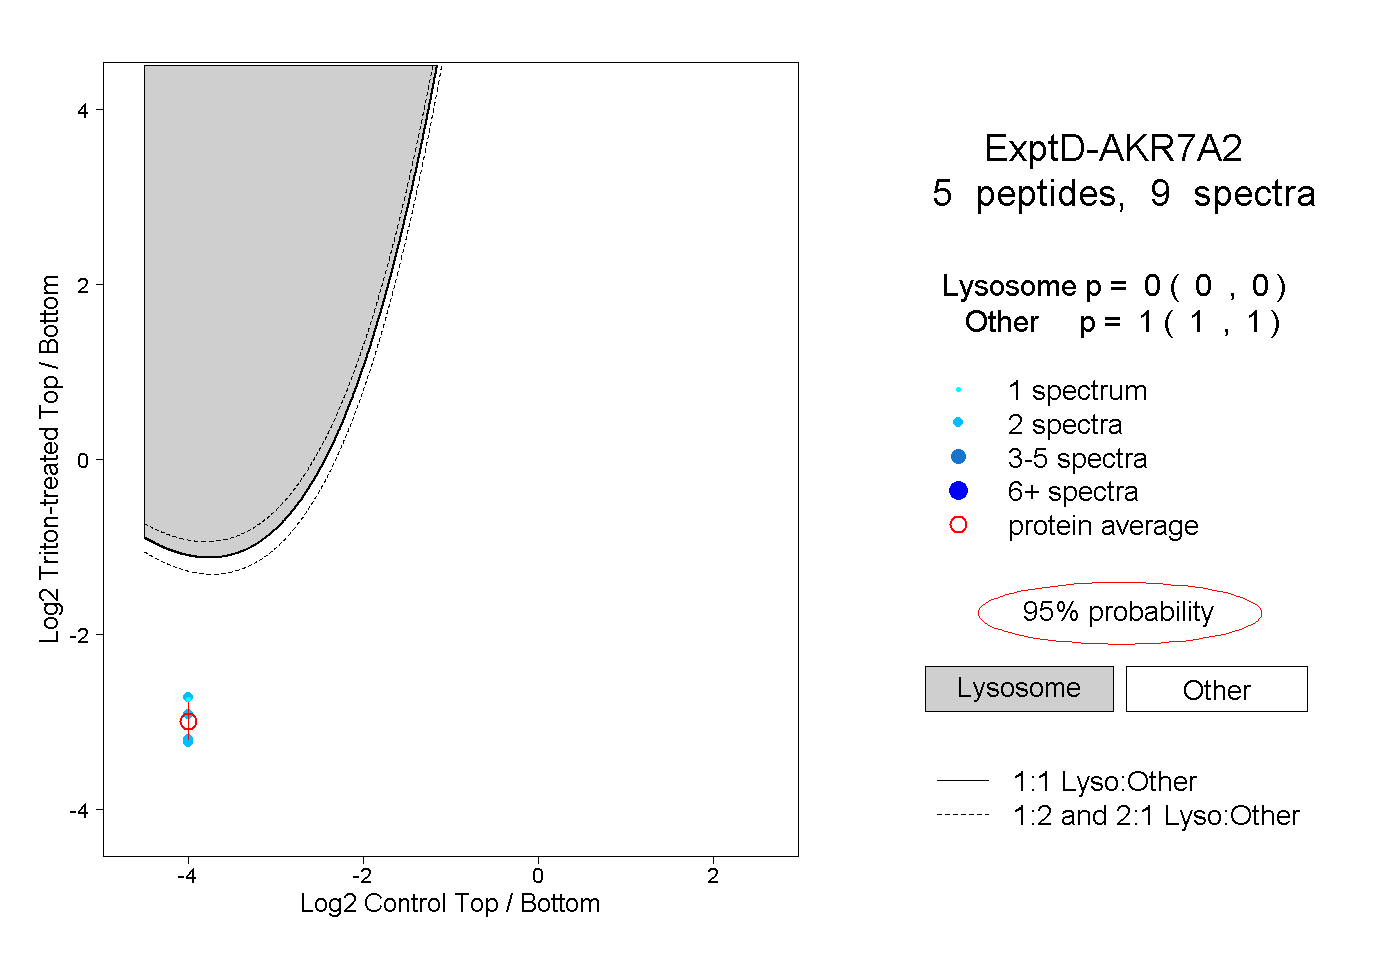
0.023 | 0.032
0.000 | 0.000
0.000 | 0.000
0.000 | 0.000
0.000 | 0.000
0.782 | 0.787
0.000 | 0.000
7peptides
spectra
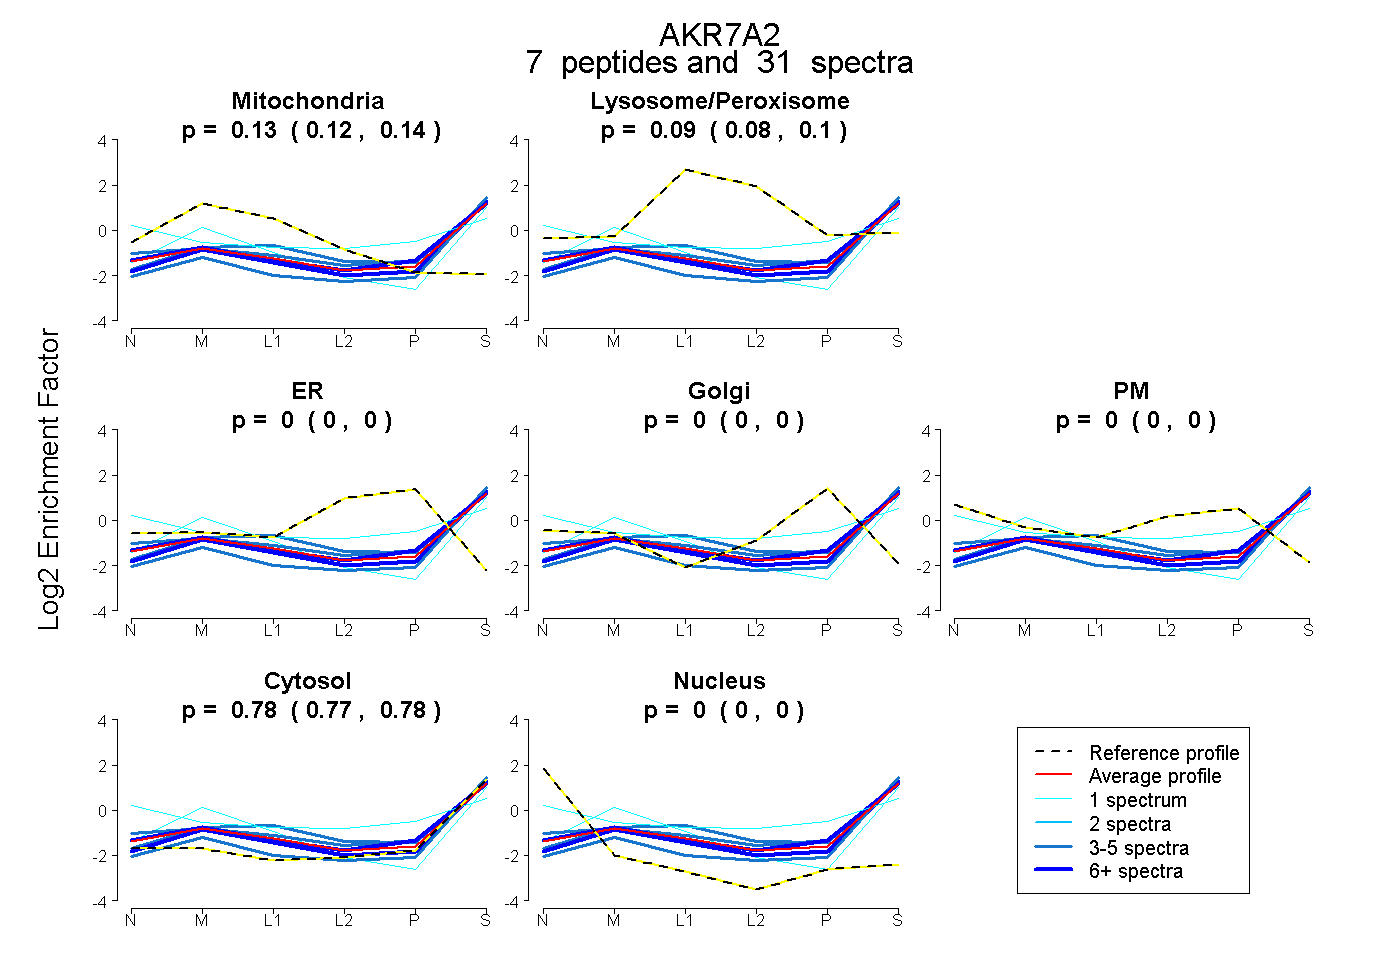
0.119 | 0.136
0.082 | 0.103
0.000 | 0.000
0.000 | 0.000
0.000 | 0.000
0.770 | 0.784
0.000 | 0.000