 11
11peptides
spectra
0.183 | 0.191
0.023 | 0.032
0.000 | 0.000
0.000 | 0.000
0.000 | 0.000
0.000 | 0.000
0.782 | 0.787
0.000 | 0.000
| Plot | Mito | Lyso | Perox | ER | Golgi | PM | Cytosol | Nucleus | |||||
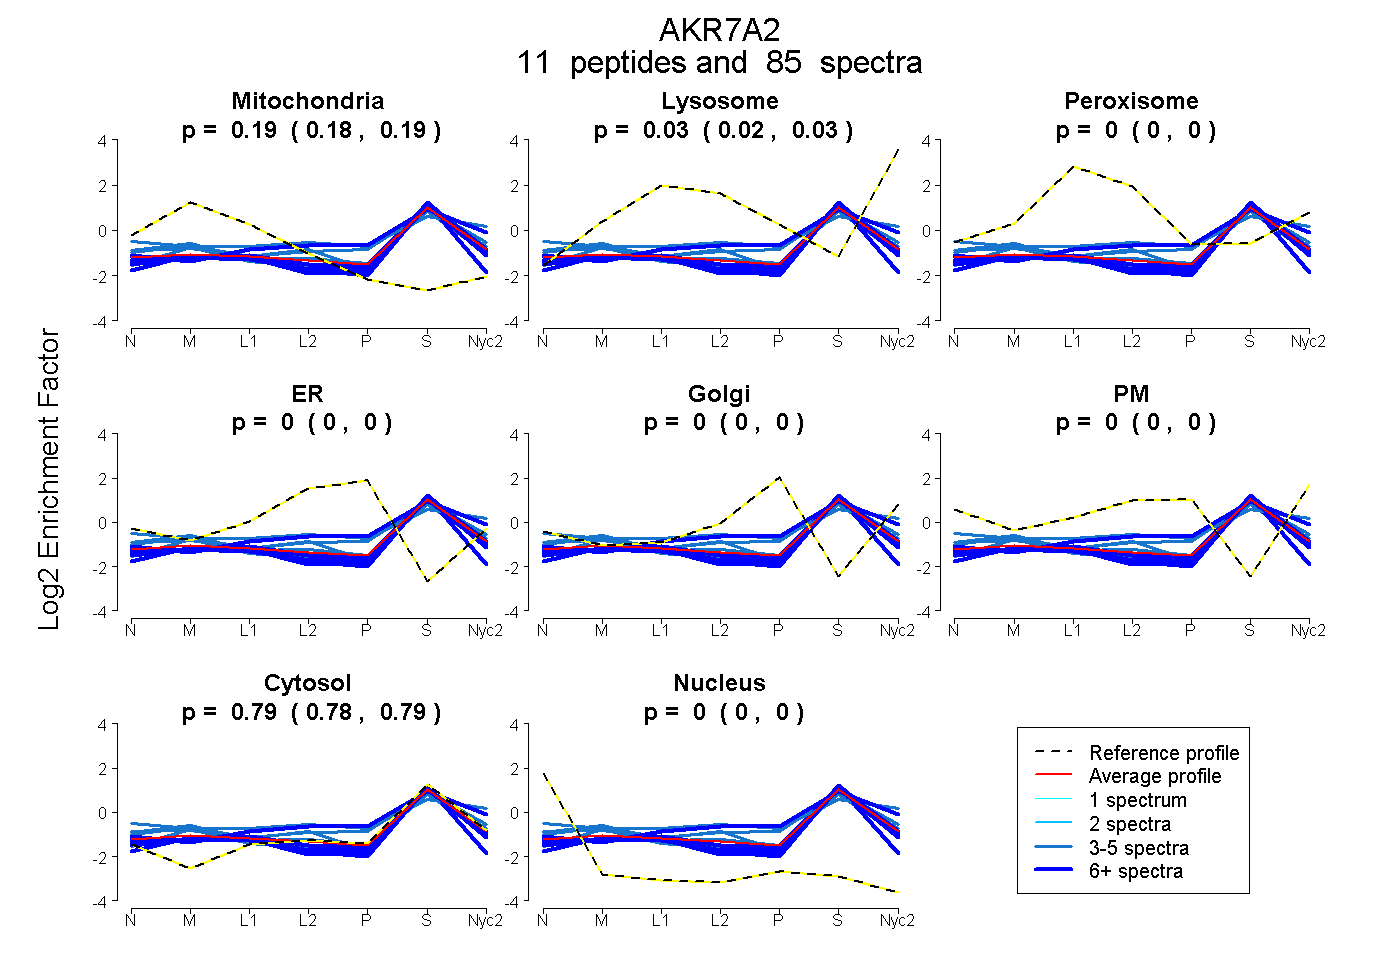
| Expt A |
11 peptides |
85 spectra |
|
0.187 0.183 | 0.191 |
0.028 0.023 | 0.032 |
0.000 0.000 | 0.000 |
0.000 0.000 | 0.000 |
0.000 0.000 | 0.000 |
0.000 0.000 | 0.000 |
0.785 0.782 | 0.787 |
0.000 0.000 | 0.000 |
| 6 spectra, WMYHHSQLQGTR | 0.001 | 0.111 | 0.077 | 0.000 | 0.071 | 0.011 | 0.730 | 0.000 | ||
| 5 spectra, FYAYNPLAGGLLTGK | 0.177 | 0.064 | 0.024 | 0.000 | 0.043 | 0.000 | 0.691 | 0.000 | ||
| 5 spectra, ANPWDGK | 0.277 | 0.015 | 0.000 | 0.000 | 0.000 | 0.000 | 0.707 | 0.000 | ||
| 3 spectra, SNGWILPTVYQGMYNATTR | 0.083 | 0.097 | 0.054 | 0.000 | 0.000 | 0.170 | 0.596 | 0.000 | ||
| 9 spectra, SLKPDSVR | 0.177 | 0.000 | 0.001 | 0.000 | 0.000 | 0.000 | 0.822 | 0.000 | ||
| 4 spectra, FFGNSWSETYR | 0.205 | 0.000 | 0.000 | 0.000 | 0.000 | 0.000 | 0.795 | 0.000 | ||
| 7 spectra, SQLETSLK | 0.178 | 0.000 | 0.000 | 0.000 | 0.000 | 0.000 | 0.822 | 0.000 | ||
| 10 spectra, TTYGTSAPSMTSAALR | 0.170 | 0.000 | 0.000 | 0.000 | 0.000 | 0.000 | 0.830 | 0.000 | ||
| 19 spectra, MDASASAATVR | 0.157 | 0.000 | 0.000 | 0.000 | 0.000 | 0.000 | 0.843 | 0.000 | ||
| 4 spectra, EHHFEAIALVEK | 0.193 | 0.064 | 0.025 | 0.000 | 0.000 | 0.000 | 0.719 | 0.000 | ||
| 13 spectra, QVETELLPCLR | 0.201 | 0.000 | 0.000 | 0.000 | 0.000 | 0.000 | 0.790 | 0.009 |
| Plot | Mito | Lyso or Perox | ER | Golgi | PM | Cytosol | Nucleus | ||||||
| Expt B |
7 peptides |
31 spectra |
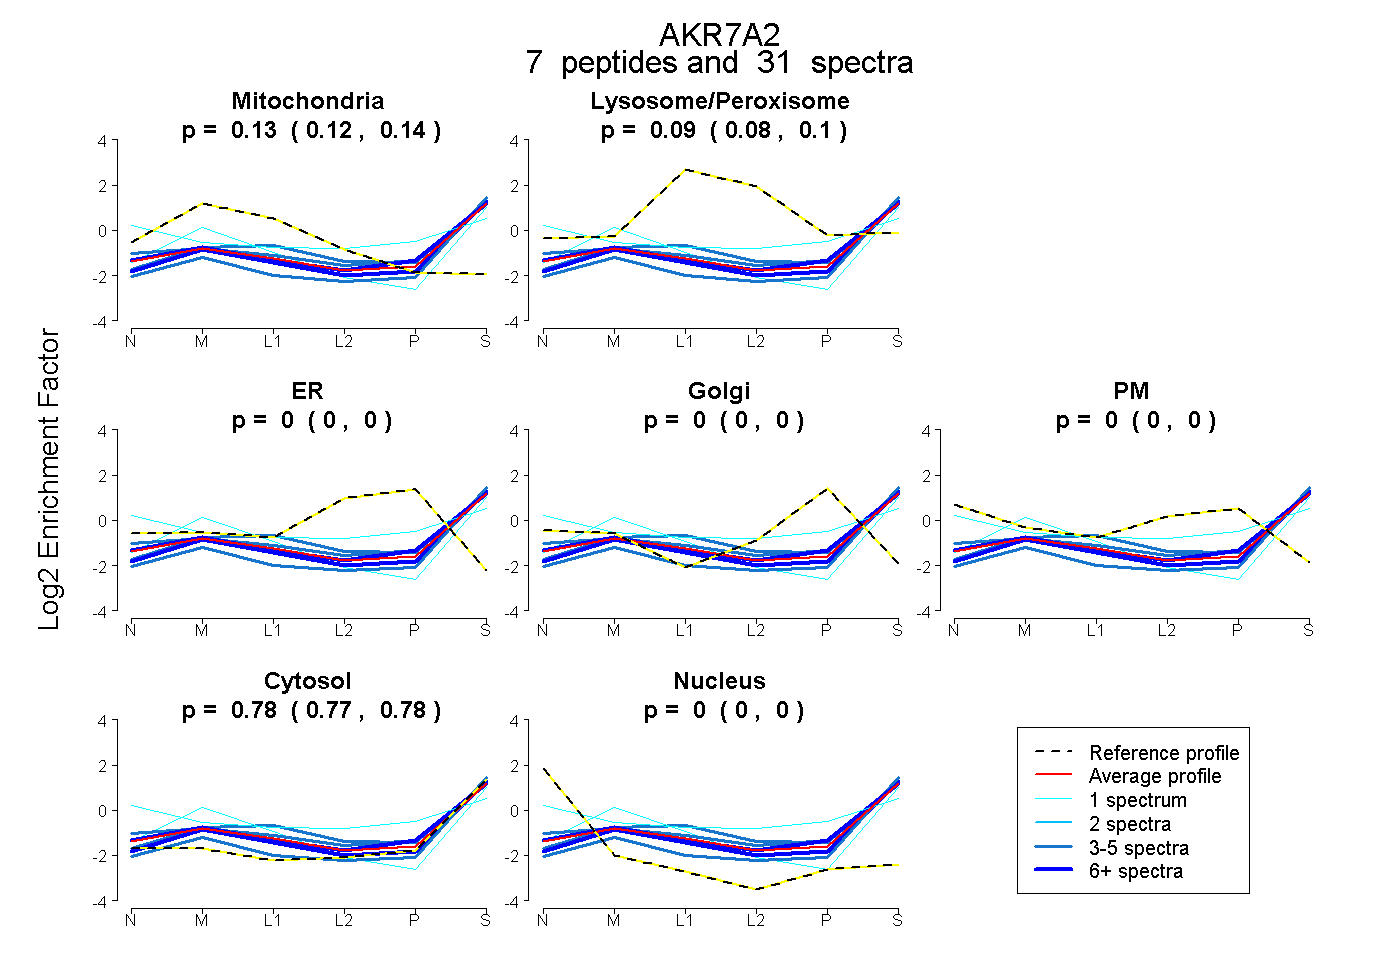 |
0.129 0.119 | 0.136 |
0.094 0.082 | 0.103 |
0.000 0.000 | 0.000 |
0.000 0.000 | 0.000 |
0.000 0.000 | 0.000 |
0.778 0.770 | 0.784 |
0.000 0.000 | 0.000 |
|||
| Plot | Lyso | Other | |||||||||||
| Expt C |
11 peptides |
130 spectra |
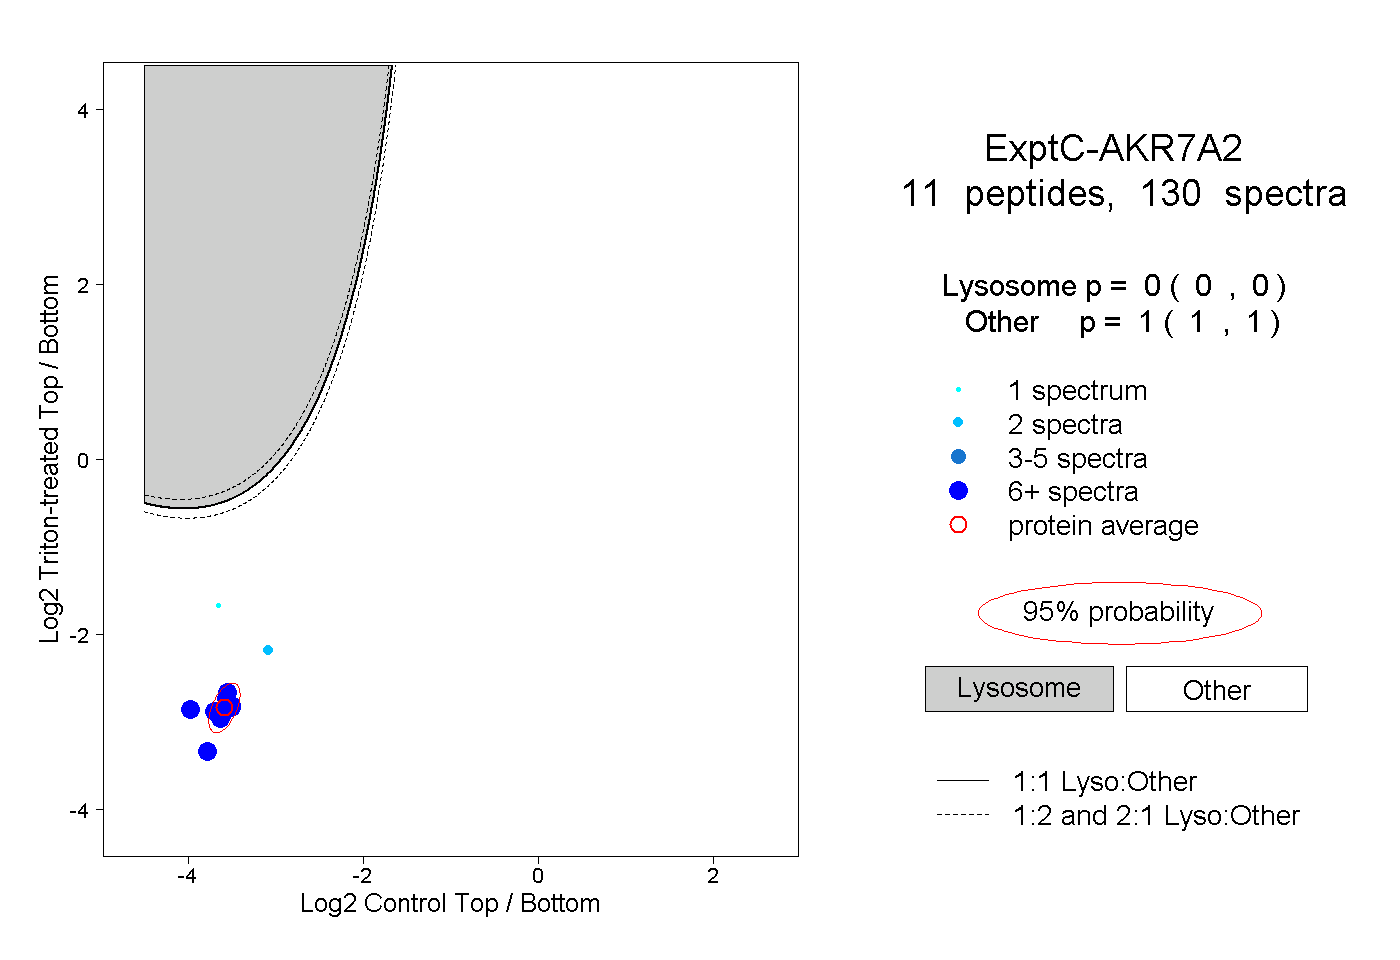 |
0.000 0.000 | 0.000 |
1.000 1.000 | 1.000 |
||||||||
| Plot | Lyso | Other | |||||||||||
| Expt D |
5 peptides |
9 spectra |
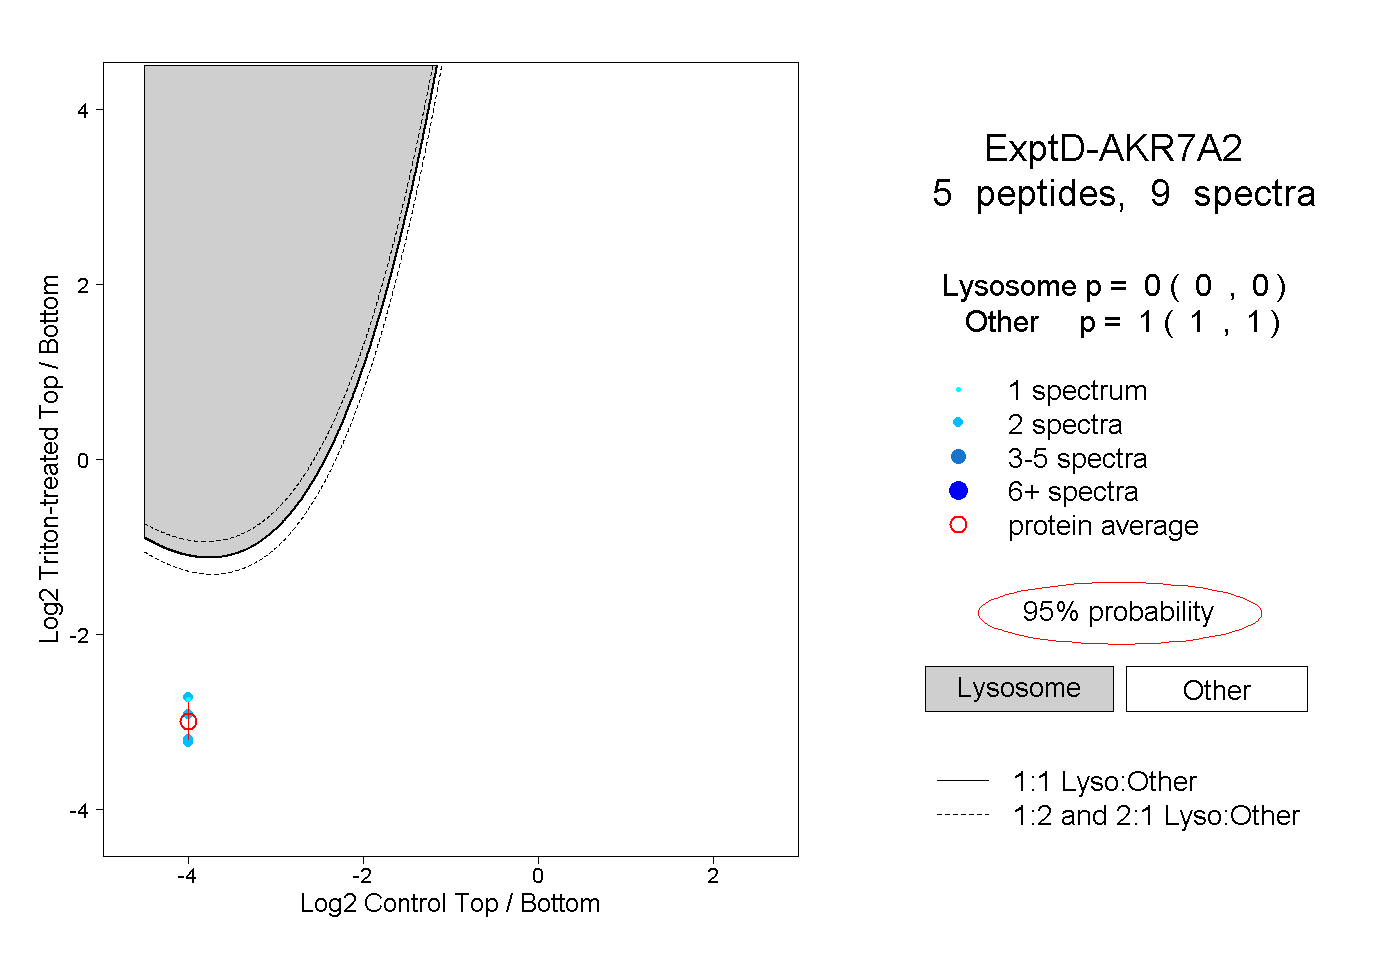 |
0.000 0.000 | 0.000 |
1.000 1.000 | 1.000 |