 2
2peptides
spectra
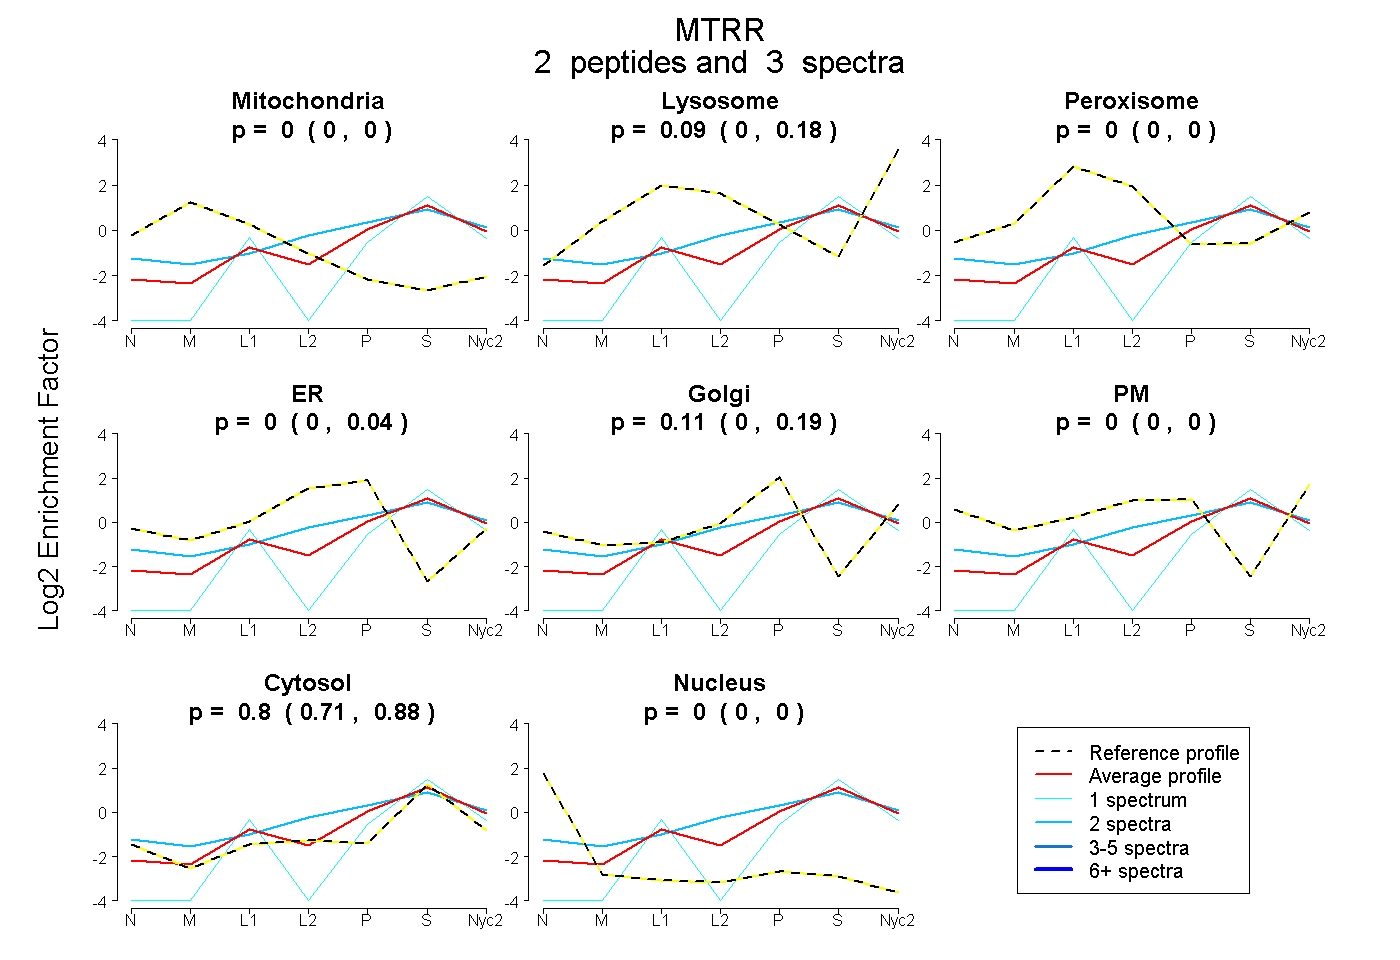
0.000 | 0.000
0.000 | 0.182
0.000 | 0.000
0.000 | 0.042
0.000 | 0.192
0.000 | 0.000
0.710 | 0.877
0.000 | 0.000
| Plot | Mito | Lyso | Perox | ER | Golgi | PM | Cytosol | Nucleus | |||||
| Expt A |
2 peptides |
3 spectra |
|
0.000 0.000 | 0.000 |
0.090 0.000 | 0.182 |
0.000 0.000 | 0.000 |
0.000 0.000 | 0.042 |
0.107 0.000 | 0.192 |
0.000 0.000 | 0.000 |
0.803 0.710 | 0.877 |
0.000 0.000 | 0.000 |
| 2 spectra, FLLLYATQR | 0.000 | 0.143 | 0.000 | 0.050 | 0.171 | 0.000 | 0.636 | 0.000 | ||
| 1 spectrum, DVHDALVEIISK | 0.000 | 0.000 | 0.000 | 0.000 | 0.000 | 0.000 | 1.000 | 0.000 |
| Plot | Lyso | Other | |||||||||||
| Expt C |
1 peptide |
2 spectra |
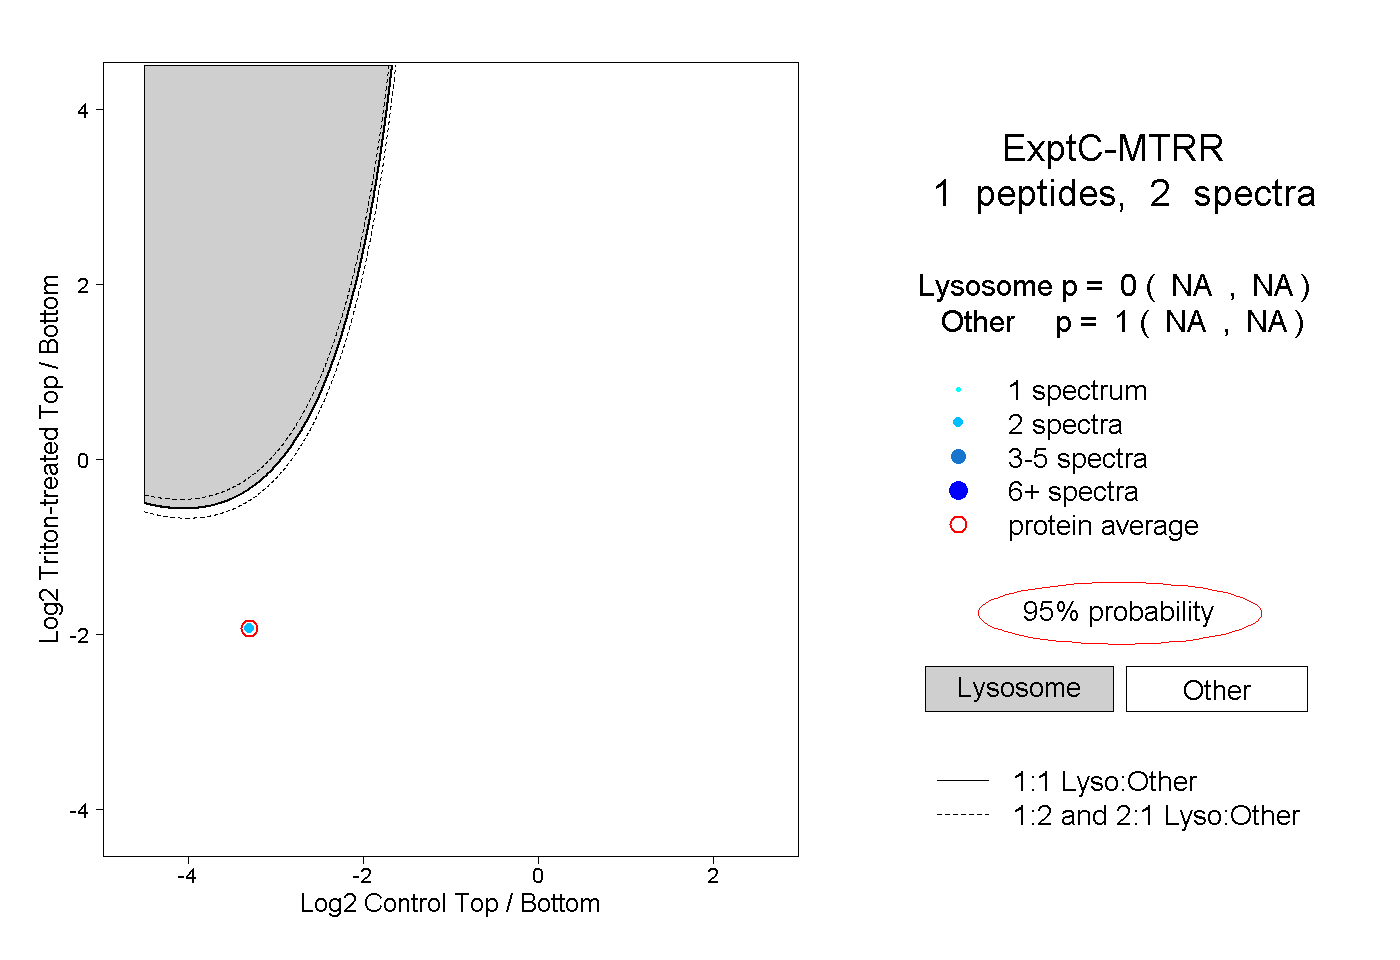 |
0.000 NA | NA |
1.000 NA | NA |