 2
2peptides
spectra
0.000 | 0.000
0.000 | 0.000
0.000 | 0.000
0.018 | 0.143
0.000 | 0.139
0.706 | 0.808
0.035 | 0.103
0.000 | 0.013
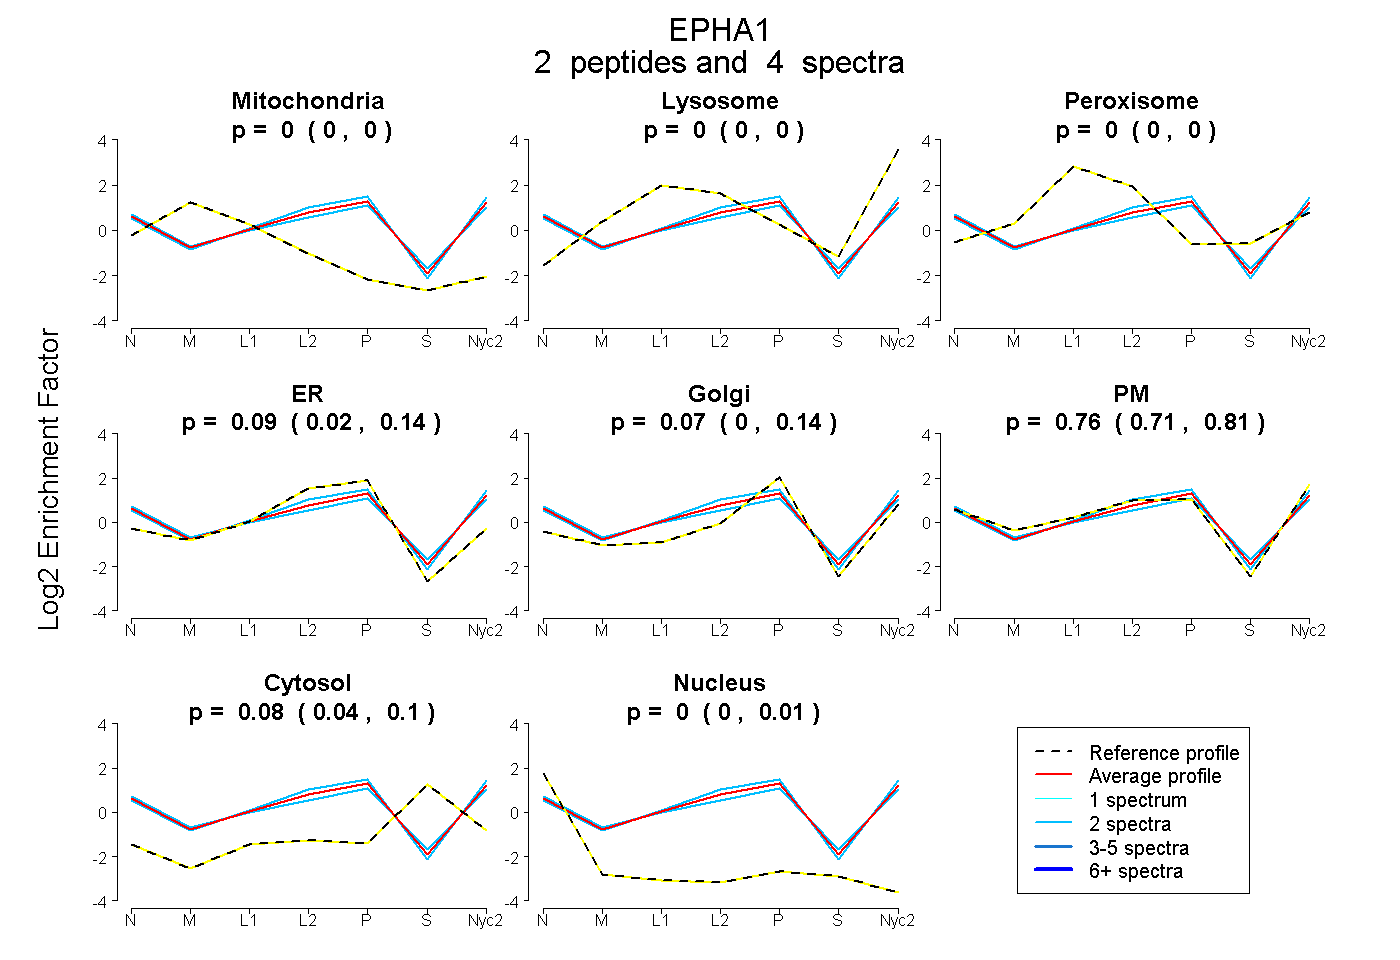
| Plot | Mito | Lyso | Perox | ER | Golgi | PM | Cytosol | Nucleus | |||||
| Expt A |
2 peptides |
4 spectra |
|
0.000 0.000 | 0.000 |
0.000 0.000 | 0.000 |
0.000 0.000 | 0.000 |
0.088 0.018 | 0.143 |
0.074 0.000 | 0.139 |
0.763 0.706 | 0.808 |
0.076 0.035 | 0.103 |
0.000 0.000 | 0.013 |
| 2 spectra, YILHFR | 0.000 | 0.000 | 0.000 | 0.112 | 0.115 | 0.757 | 0.017 | 0.000 | ||
| 2 spectra, SVSEWLESIR | 0.000 | 0.000 | 0.000 | 0.061 | 0.025 | 0.776 | 0.123 | 0.015 |