 20
20peptides
spectra
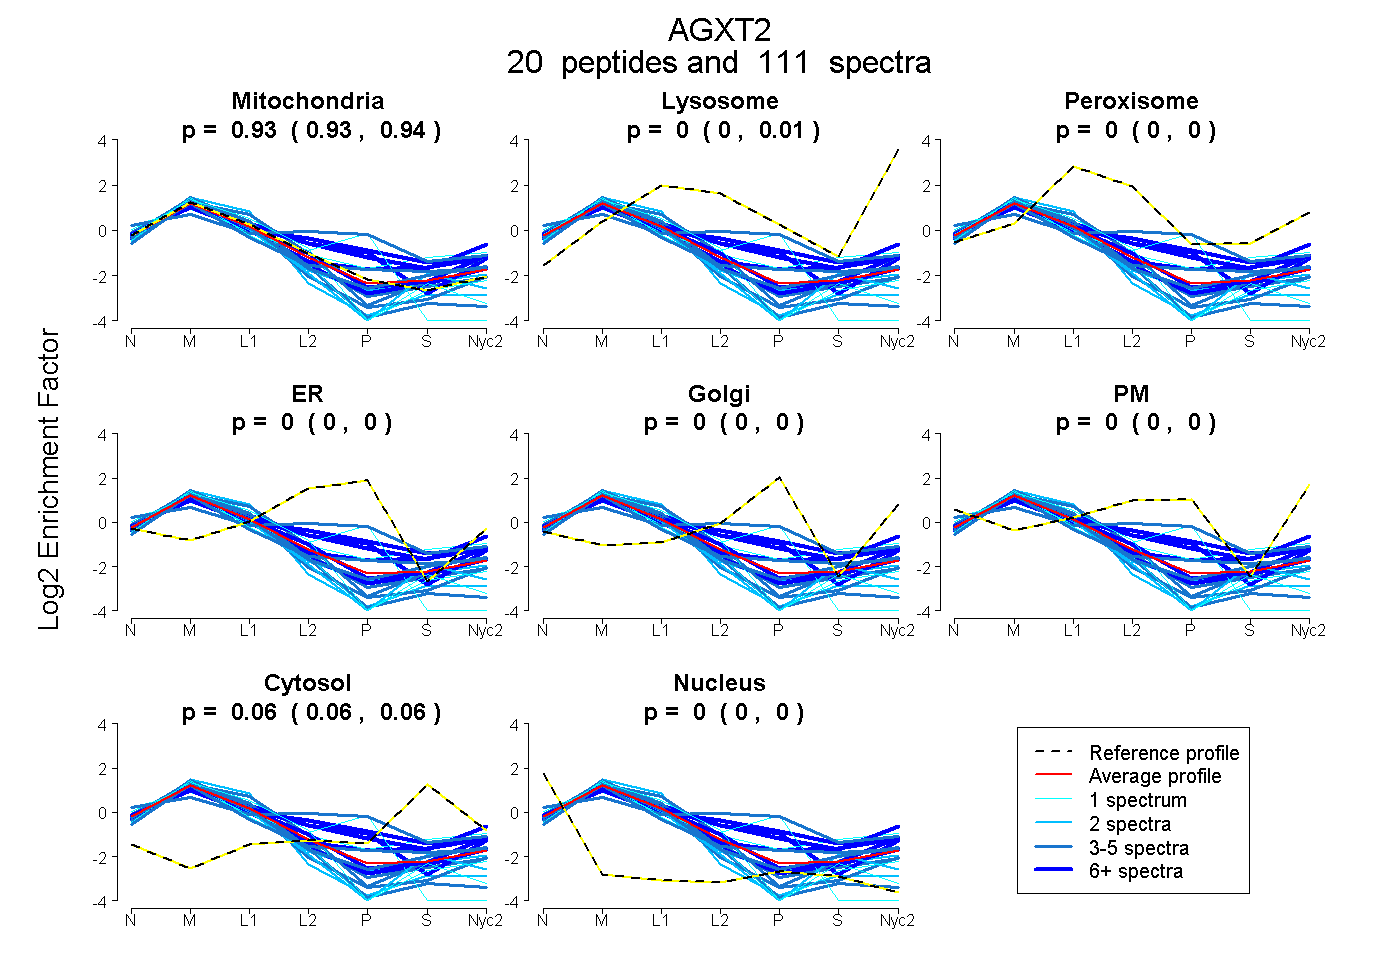
0.928 | 0.938
0.000 | 0.009
0.000 | 0.000
0.000 | 0.000
0.000 | 0.000
0.000 | 0.000
0.058 | 0.065
0.000 | 0.000
16peptides
spectra
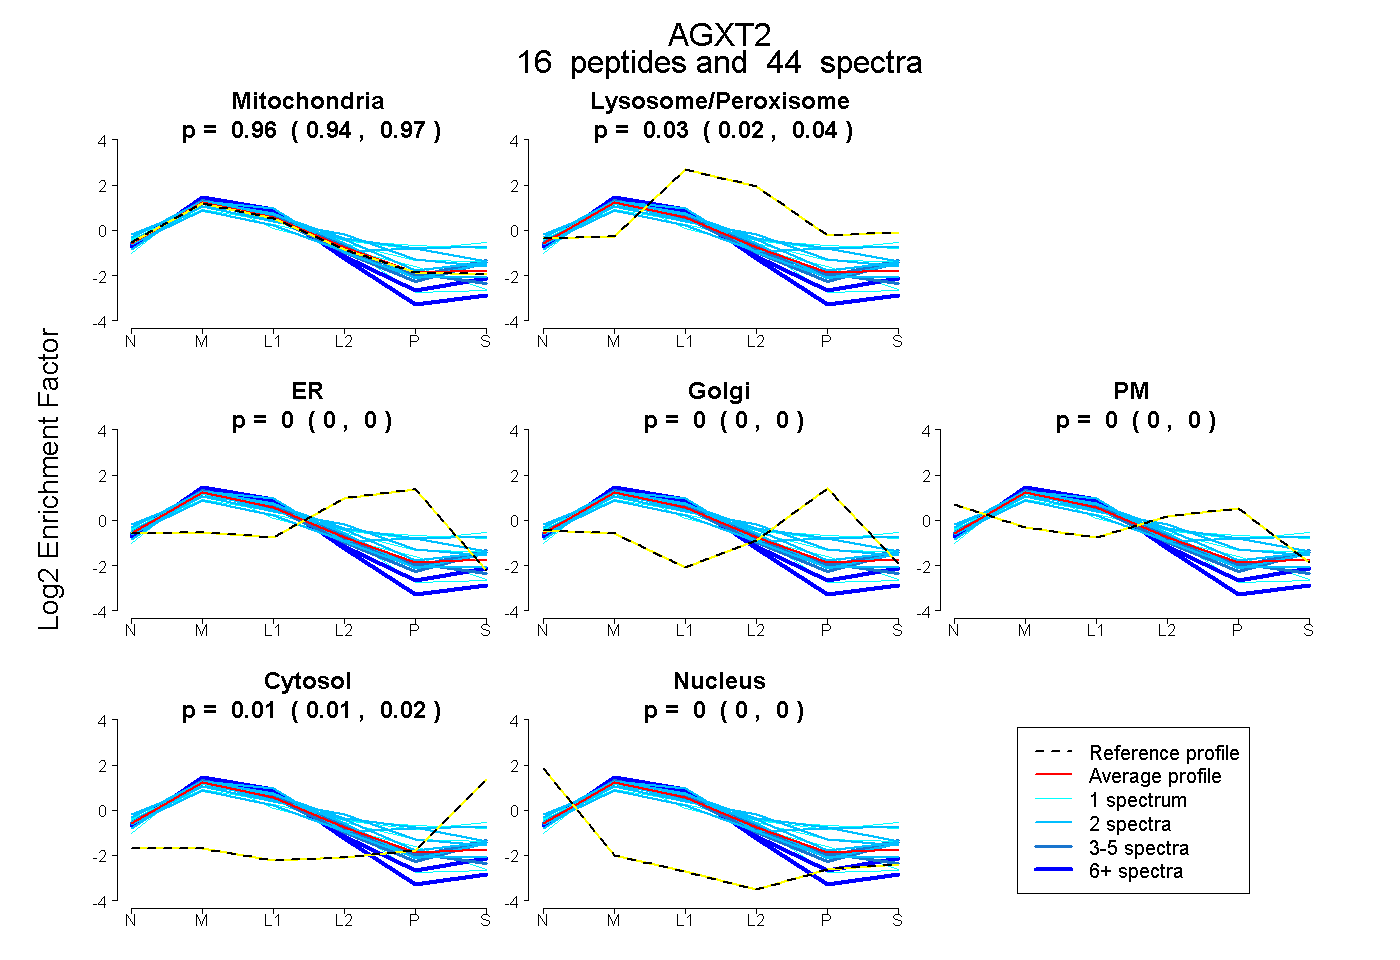
0.944 | 0.966
0.025 | 0.038
0.000 | 0.000
0.000 | 0.000
0.000 | 0.000
0.006 | 0.017
0.000 | 0.000
24peptides
spectra
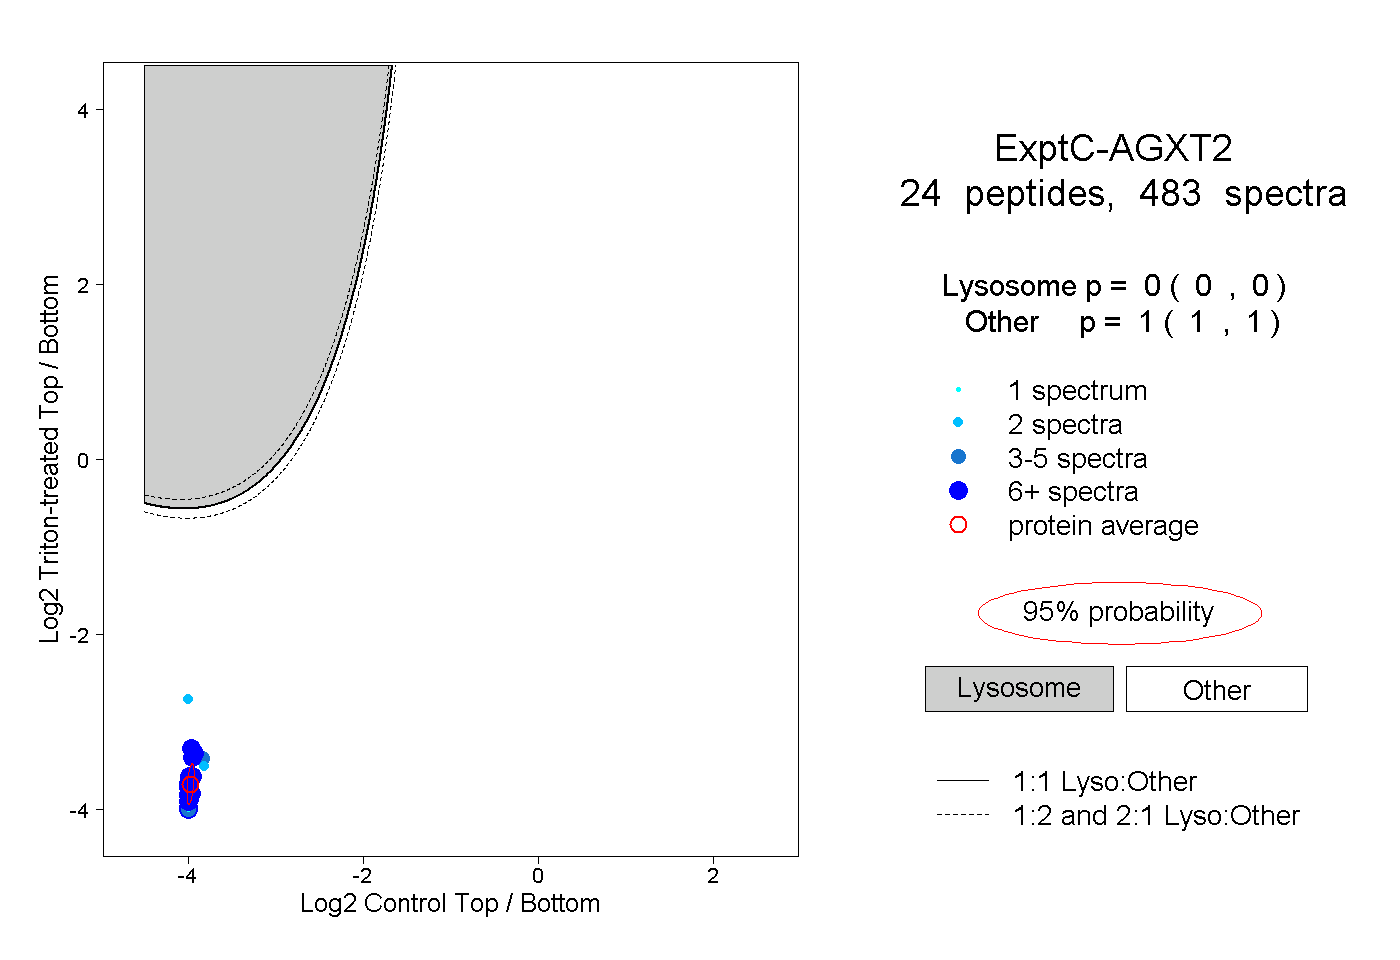
0.000 | 0.000
1.000 | 1.000
12peptides
spectra
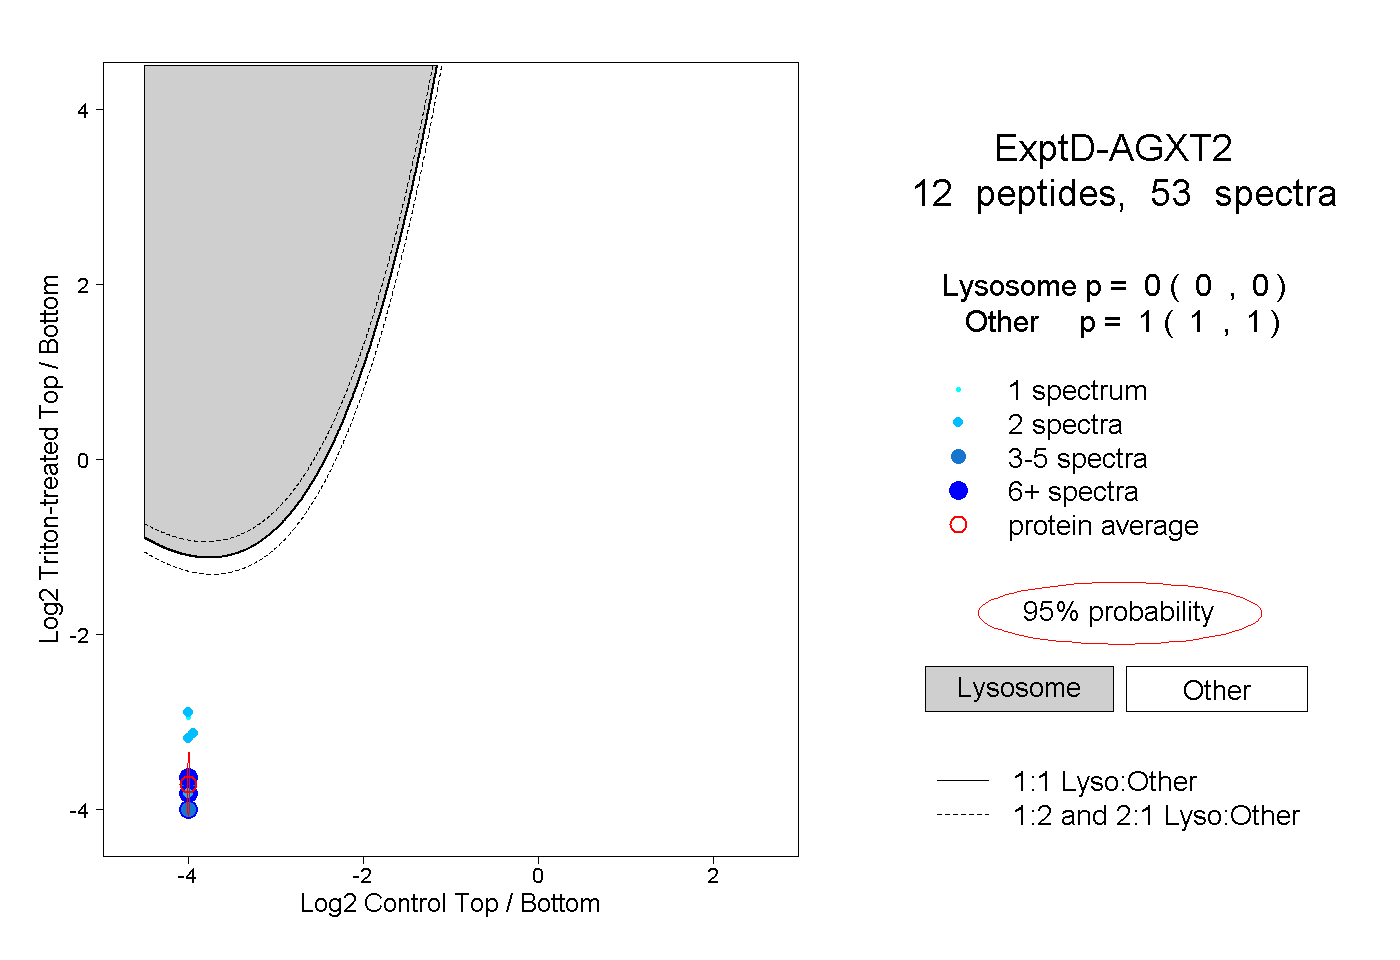
0.000 | 0.000
1.000 | 1.000