 8
8peptides
spectra
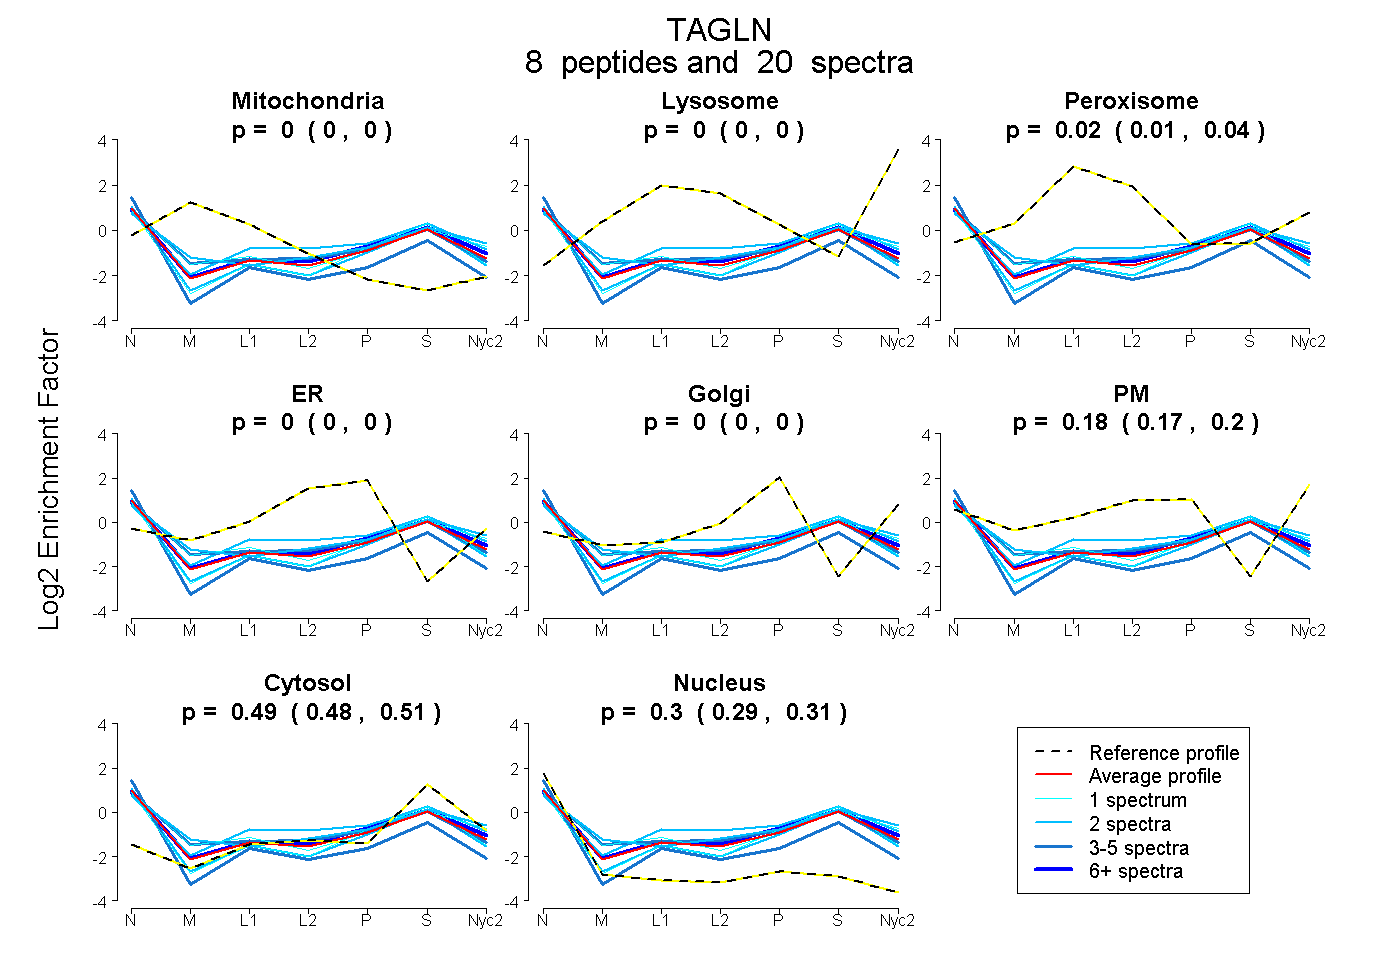
0.000 | 0.000
0.000 | 0.000
0.005 | 0.039
0.000 | 0.000
0.000 | 0.000
0.168 | 0.199
0.481 | 0.505
0.288 | 0.306
1peptide
spectra
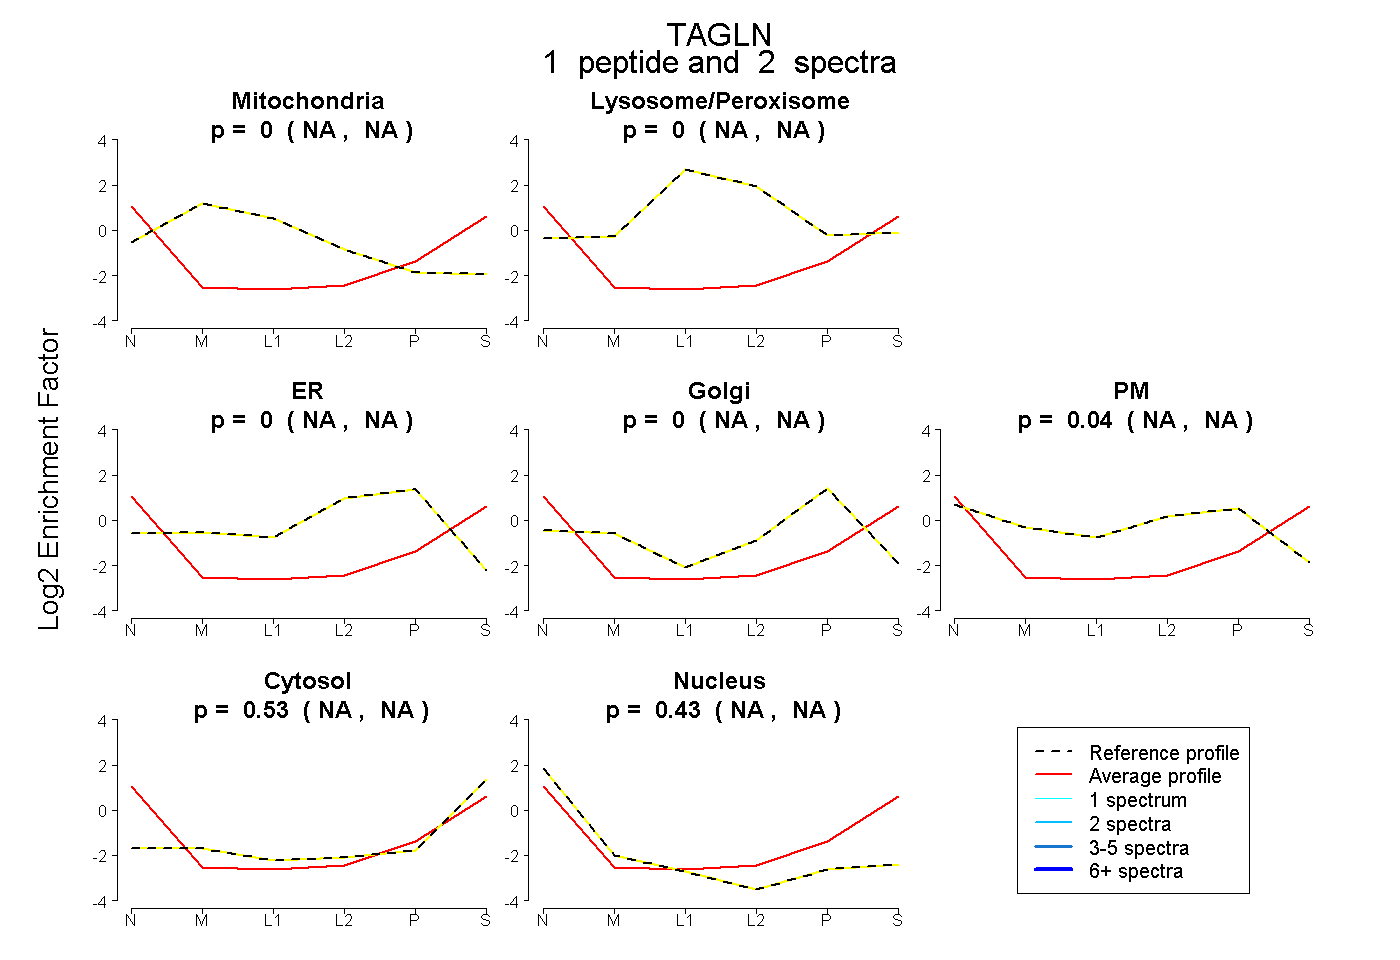
NA | NA
NA | NA
NA | NA
NA | NA
NA | NA
NA | NA
NA | NA
5peptides
spectra
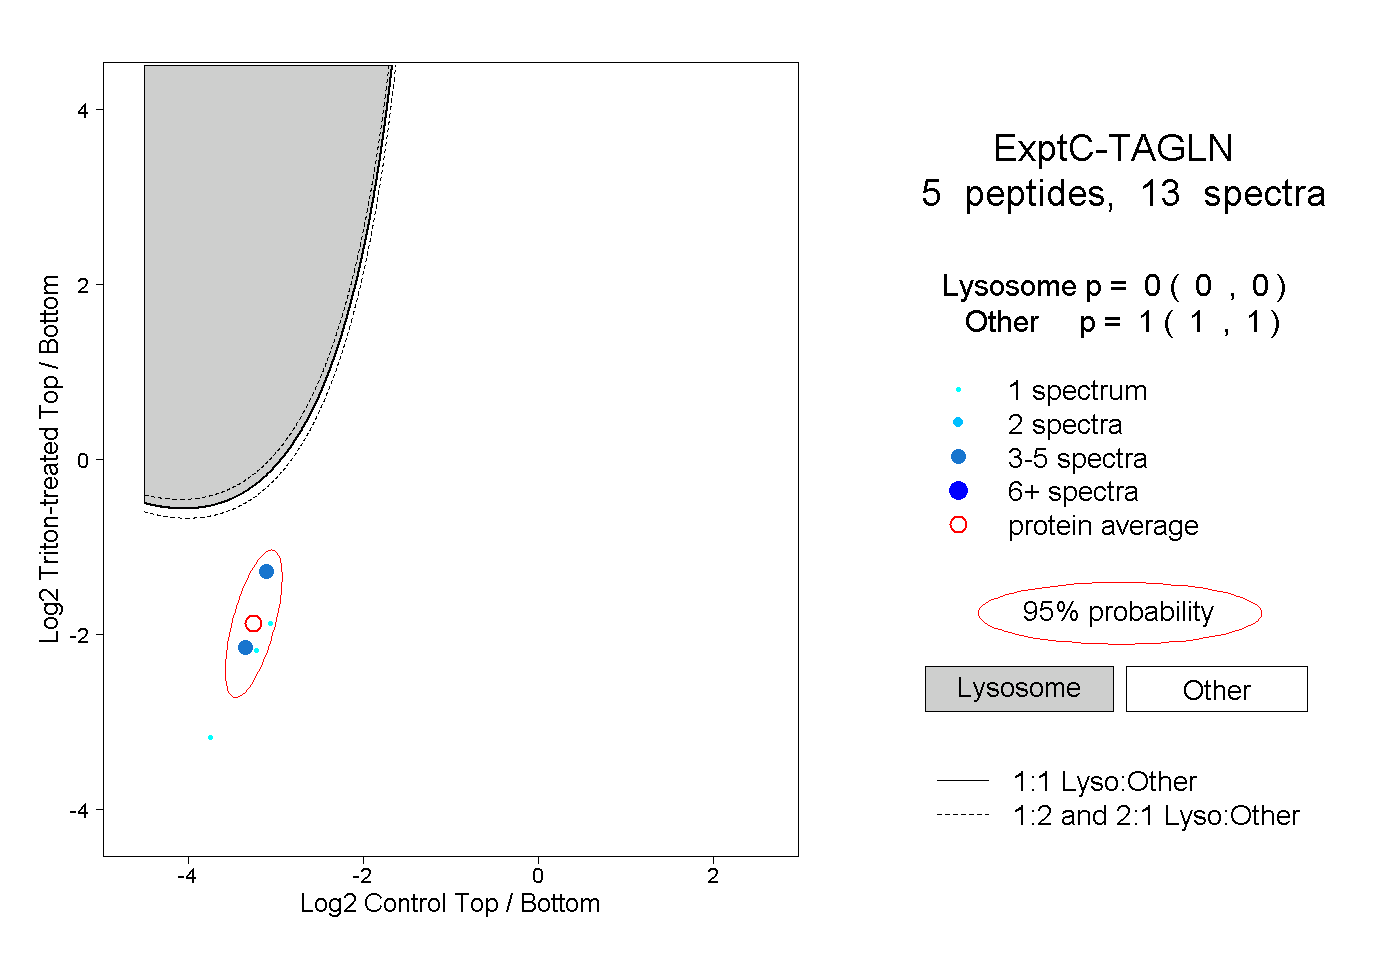
0.000 | 0.000
1.000 | 1.000
1peptide
spectrum
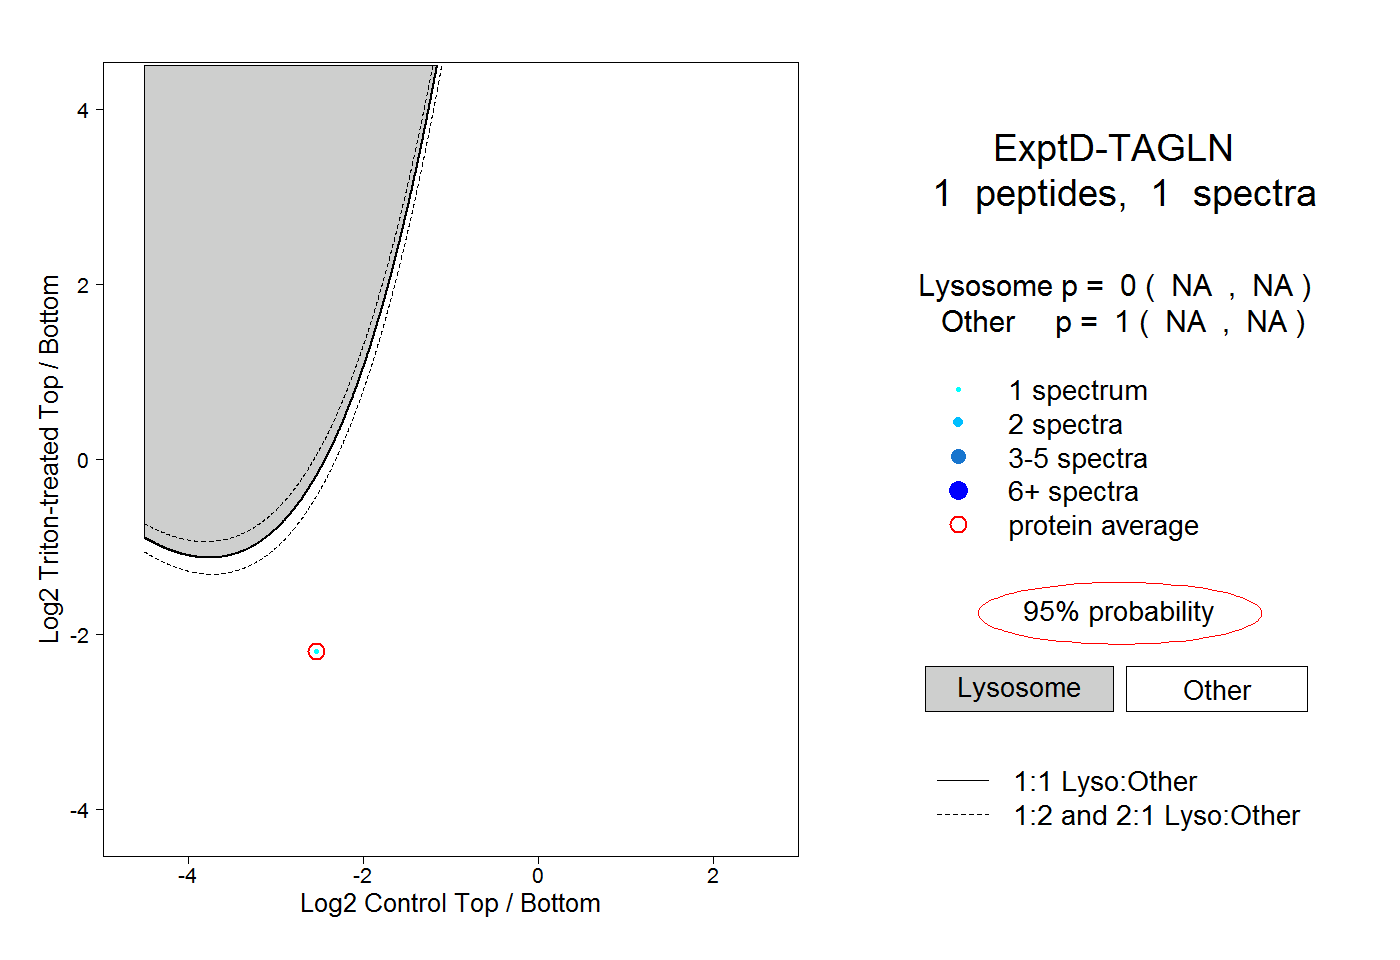
NA | NA
NA | NA