 4
4peptides
spectra
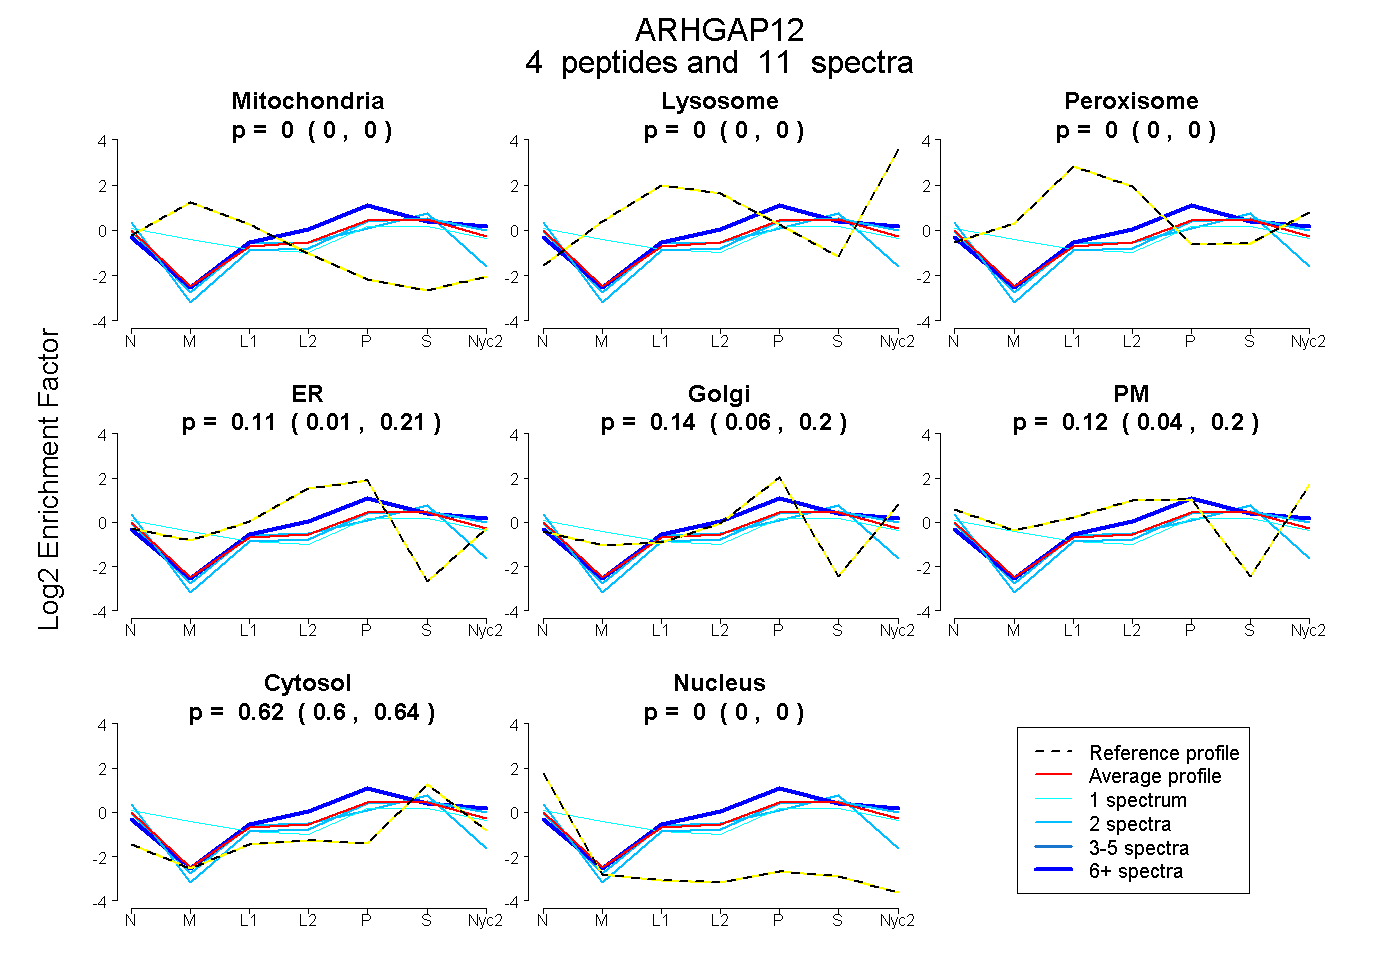
0.000 | 0.000
0.000 | 0.000
0.000 | 0.000
0.009 | 0.206
0.063 | 0.203
0.037 | 0.202
0.601 | 0.640
0.000 | 0.003
| Plot | Mito | Lyso | Perox | ER | Golgi | PM | Cytosol | Nucleus | |||||
| Expt A |
4 peptides |
11 spectra |
|
0.000 0.000 | 0.000 |
0.000 0.000 | 0.000 |
0.000 0.000 | 0.000 |
0.114 0.009 | 0.206 |
0.139 0.063 | 0.203 |
0.125 0.037 | 0.202 |
0.622 0.601 | 0.640 |
0.000 0.000 | 0.003 |
| 2 spectra, LCIEHVEEHGLDVDGIYR | 0.000 | 0.000 | 0.000 | 0.259 | 0.000 | 0.000 | 0.682 | 0.059 | ||
| 2 spectra, YNASSQQQR | 0.000 | 0.000 | 0.000 | 0.000 | 0.217 | 0.137 | 0.633 | 0.013 | ||
| 6 spectra, RPTLQAVR | 0.000 | 0.029 | 0.000 | 0.202 | 0.223 | 0.035 | 0.511 | 0.000 | ||
| 1 spectrum, YGLLNVTK | 0.152 | 0.000 | 0.000 | 0.000 | 0.165 | 0.208 | 0.476 | 0.000 |
| Plot | Lyso | Other | |||||||||||
| Expt C |
6 peptides |
19 spectra |
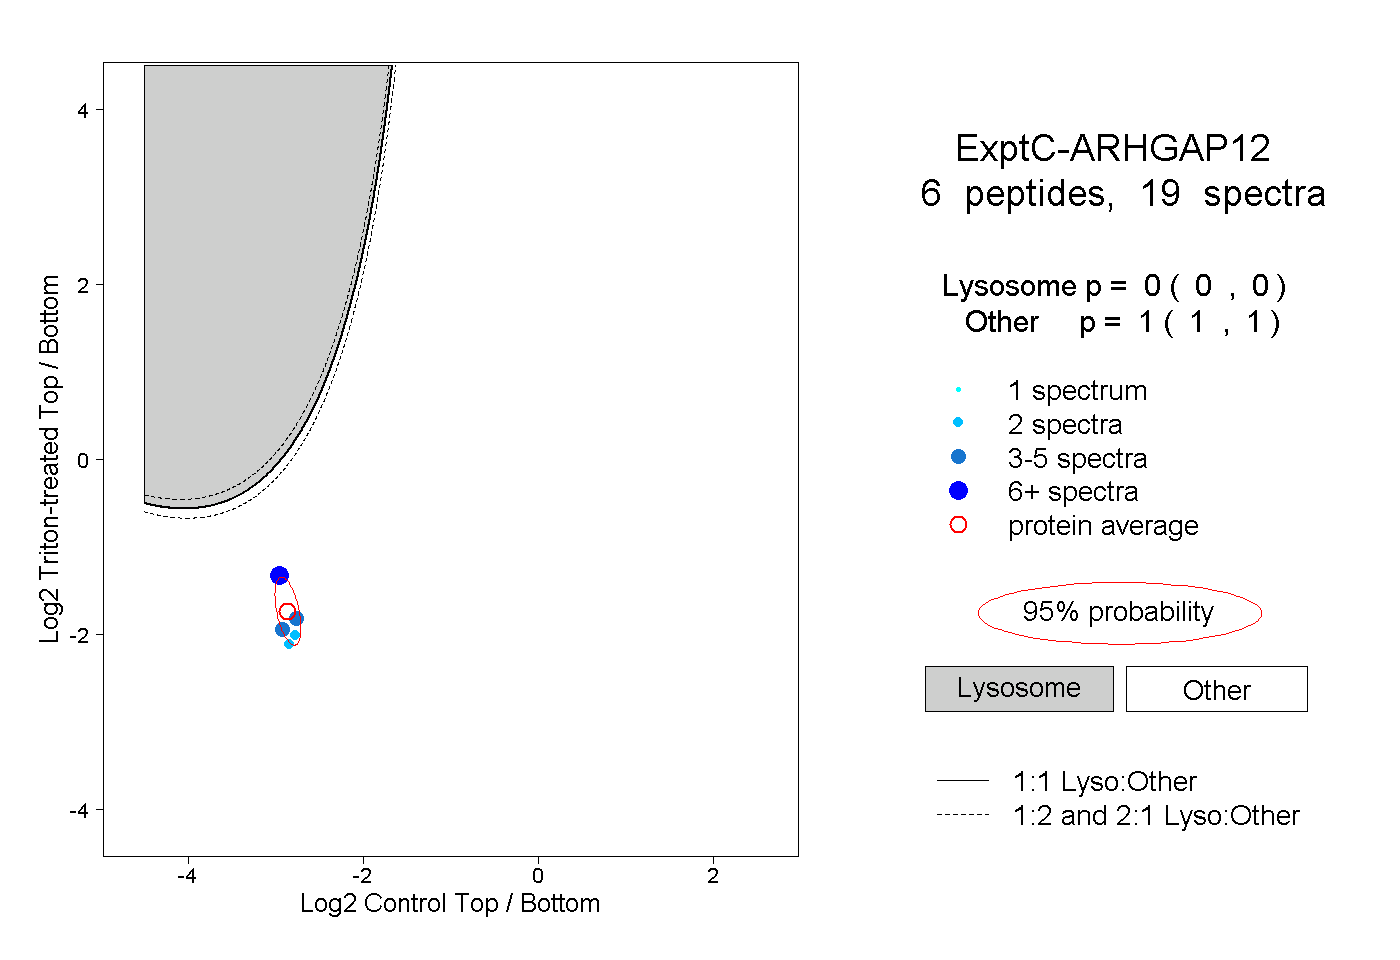 |
0.000 0.000 | 0.000 |
1.000 1.000 | 1.000 |