VPS35
[ENSRNOP00000024020]
Main page
| | | Plot |
Mito |
Lyso |
|
Perox |
ER |
Golgi |
PM |
Cytosol |
Nucleus |
|
| Expt A |
 28
28
peptides |
129
spectra |
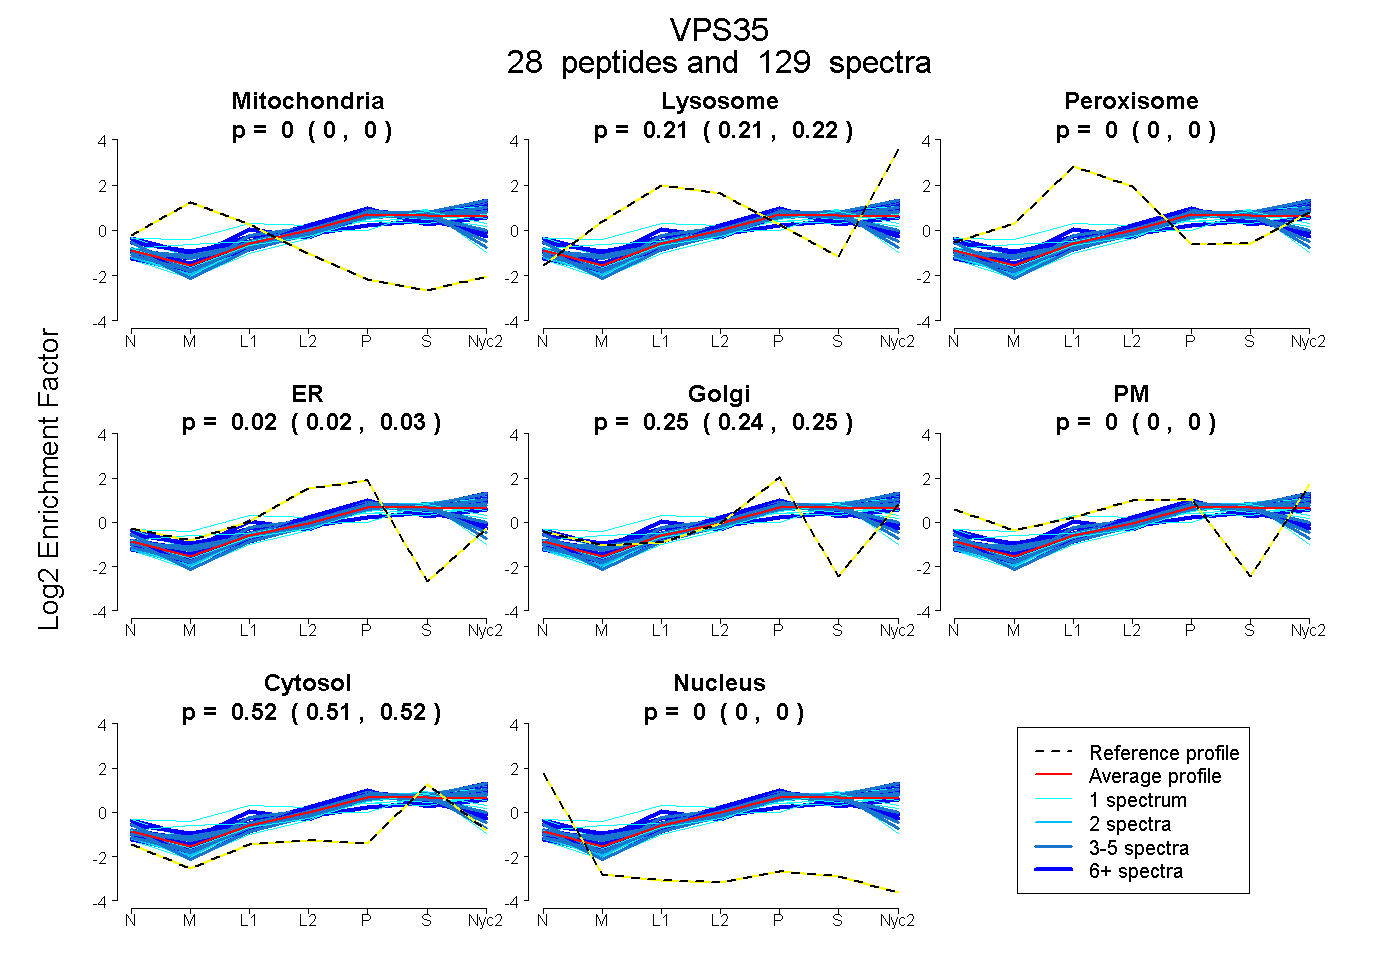 |
0.000
0.000 | 0.000 |
0.213
0.210 | 0.215 |
|
0.000
0.000 | 0.000 |
0.024
0.016 | 0.029 |
0.248
0.242 | 0.253 |
0.000
0.000 | 0.000 |
0.516
0.514 | 0.517 |
0.000
0.000 | 0.000 |
|
| | | Plot |
Mito |
|
Lyso or Perox |
|
ER |
Golgi |
PM |
Cytosol |
Nucleus |
|
| Expt B |
17
peptides |
75
spectra |
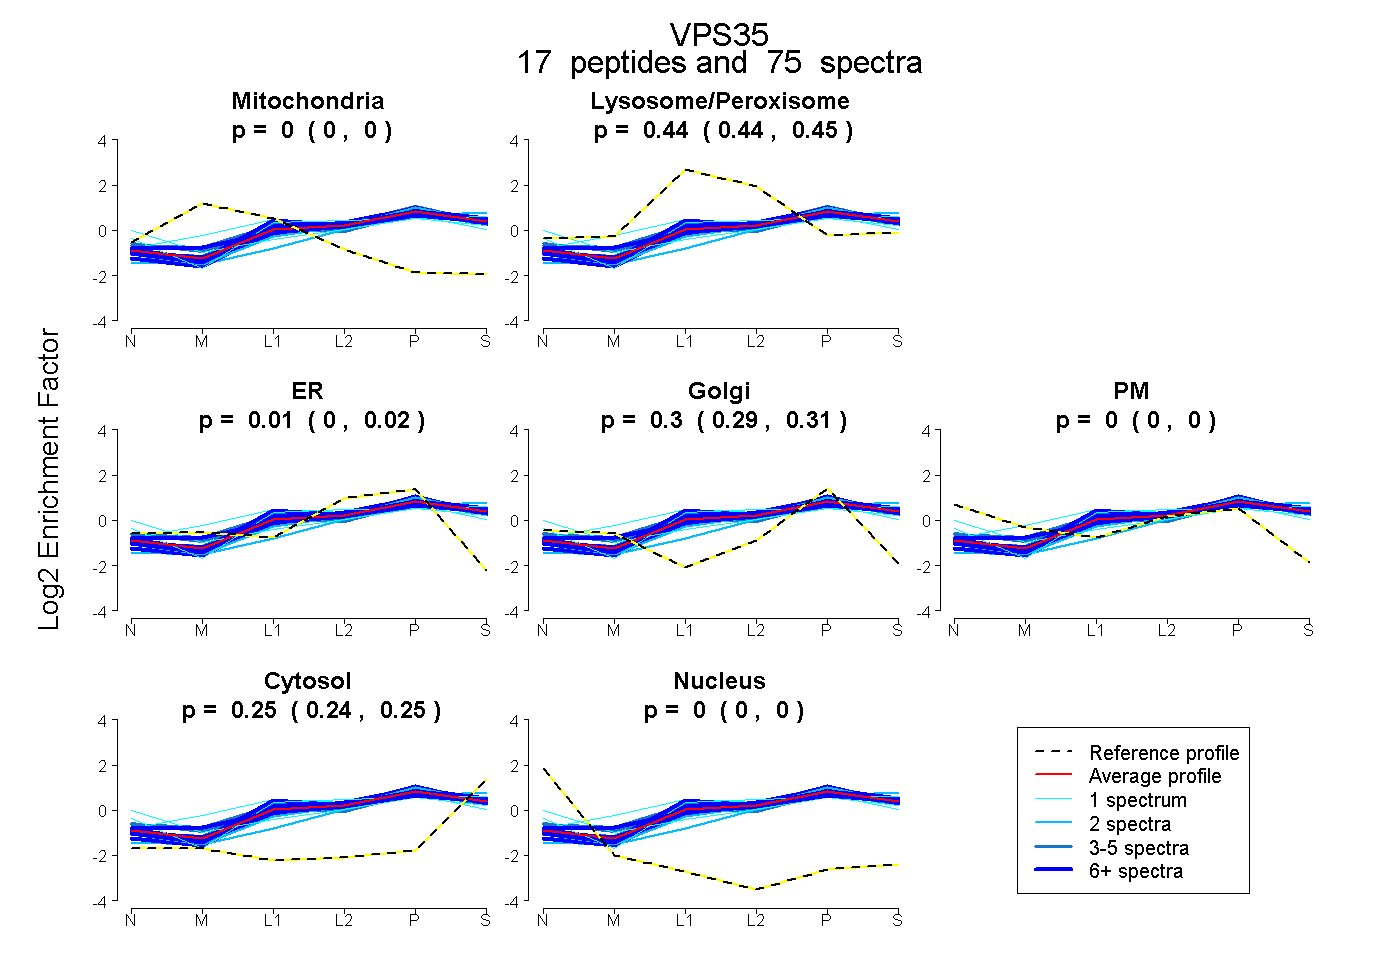 |
0.000
0.000 | 0.000 |
|
0.441
0.435 | 0.446 |
|
0.008
0.000 | 0.020 |
0.304
0.290 | 0.311 |
0.000
0.000 | 0.000 |
0.247
0.244 | 0.251 |
0.000
0.000 | 0.000 |
|
| | | Plot |
|
Lyso |
|
|
|
|
|
|
|
Other |
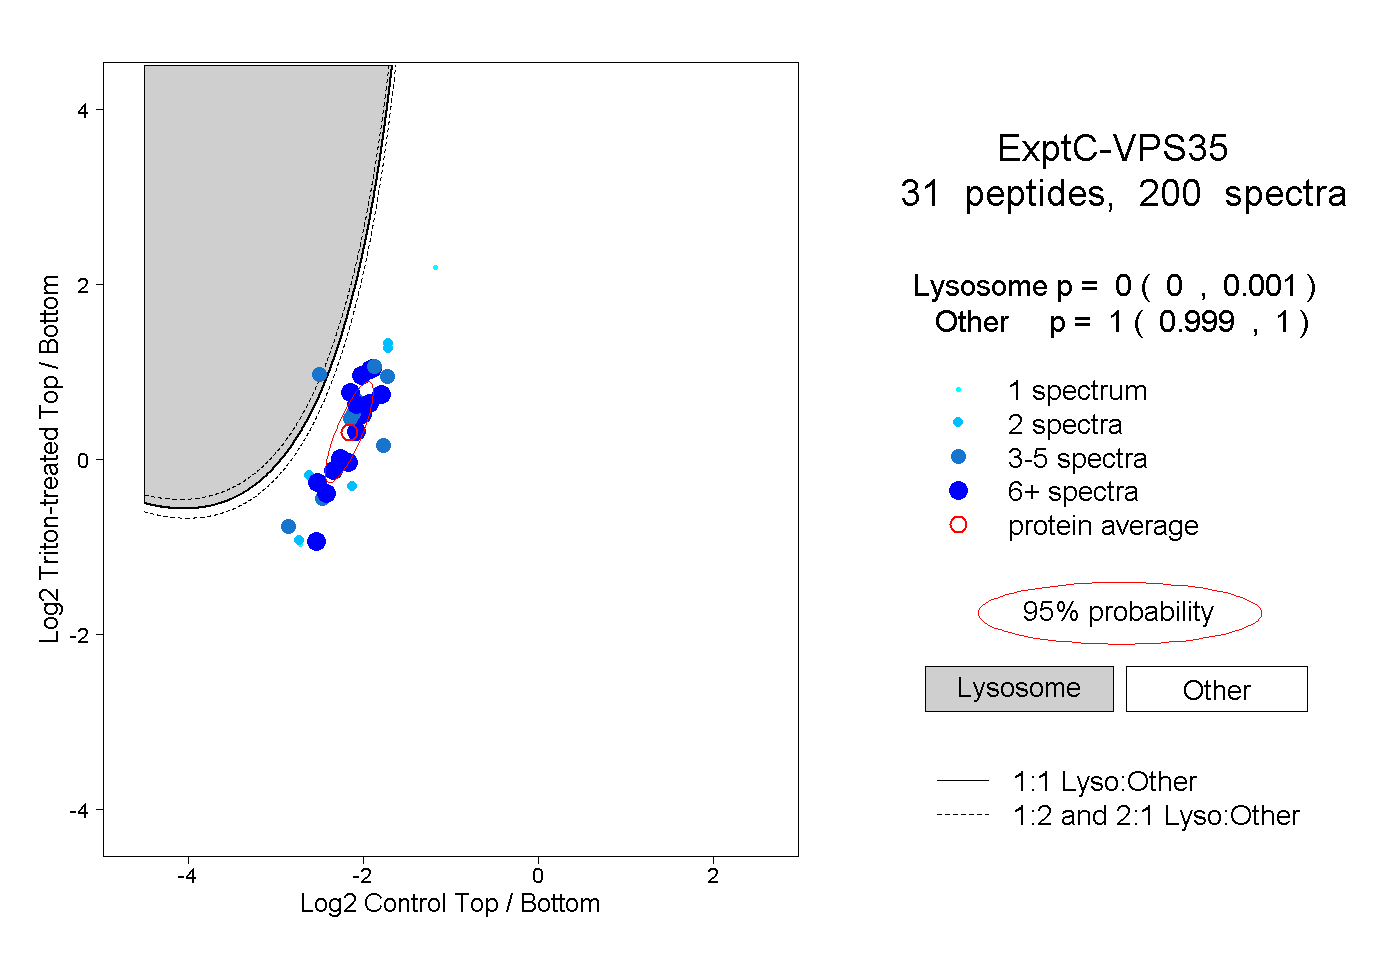
| Expt C |
31
peptides |
200
spectra |
 |
|
0.000
0.000 | 0.001 |
|
|
|
|
|
|
|
1.000
0.999 | 1.000 |
| | | Plot |
|
Lyso |
|
|
|
|
|
|
|
Other |
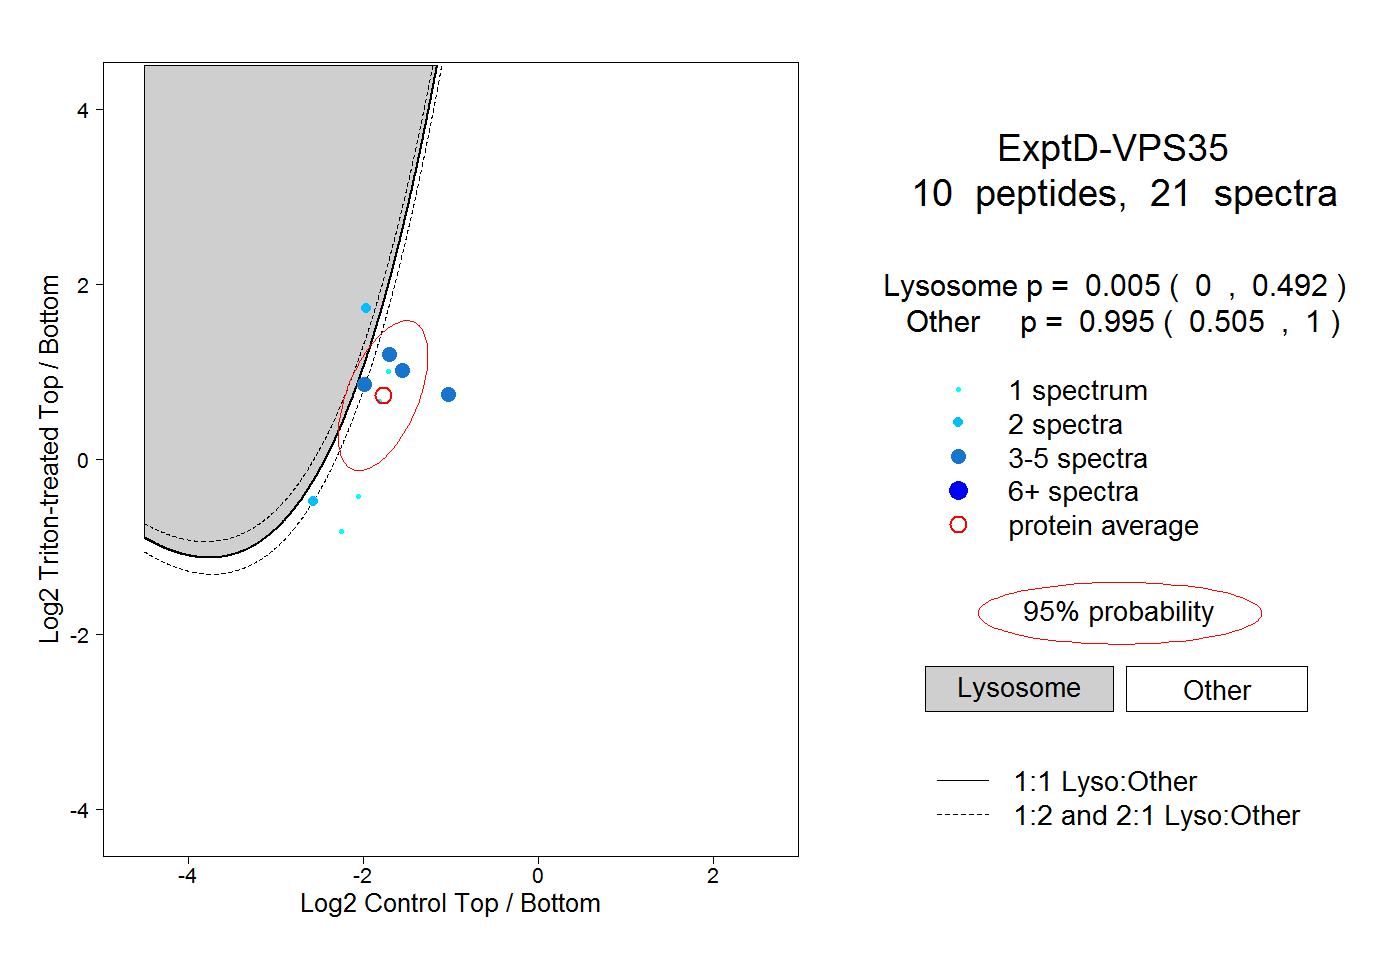
| Expt D |
10
peptides |
21
spectra |
 |
|
0.005
0.000 | 0.492 |
|
|
|
|
|
|
|
0.995
0.505 | 1.000 |
| 1 spectrum, VLETTVEIFNK |
|
0.006 |
|
|
|
|
|
|
|
0.994 |
| 3 spectra, FIHLLR |
|
0.000 |
|
|
|
|
|
|
|
1.000 |
| 4 spectra, NIIIALIDR |
|
0.000 |
|
|
|
|
|
|
|
1.000 |
| 1 spectrum, ACAELHQNVNVK |
|
0.001 |
|
|
|
|
|
|
|
0.999 |
| 2 spectra, DLVEMCR |
|
0.202 |
|
|
|
|
|
|
|
0.798 |
| 3 spectra, VDYVDK |
|
0.218 |
|
|
|
|
|
|
|
0.782 |
| 2 spectra, EDGPGIPAEIK |
|
0.953 |
|
|
|
|
|
|
|
0.047 |
| 1 spectrum, KPDQGR |
|
0.007 |
|
|
|
|
|
|
|
0.993 |
| 1 spectrum, VQSFQMK |
|
0.001 |
|
|
|
|
|
|
|
0.999 |
| 3 spectra, LLDEAIQAVK |
|
0.014 |
|
|
|
|
|
|
|
0.986 |