 15
15peptides
spectra
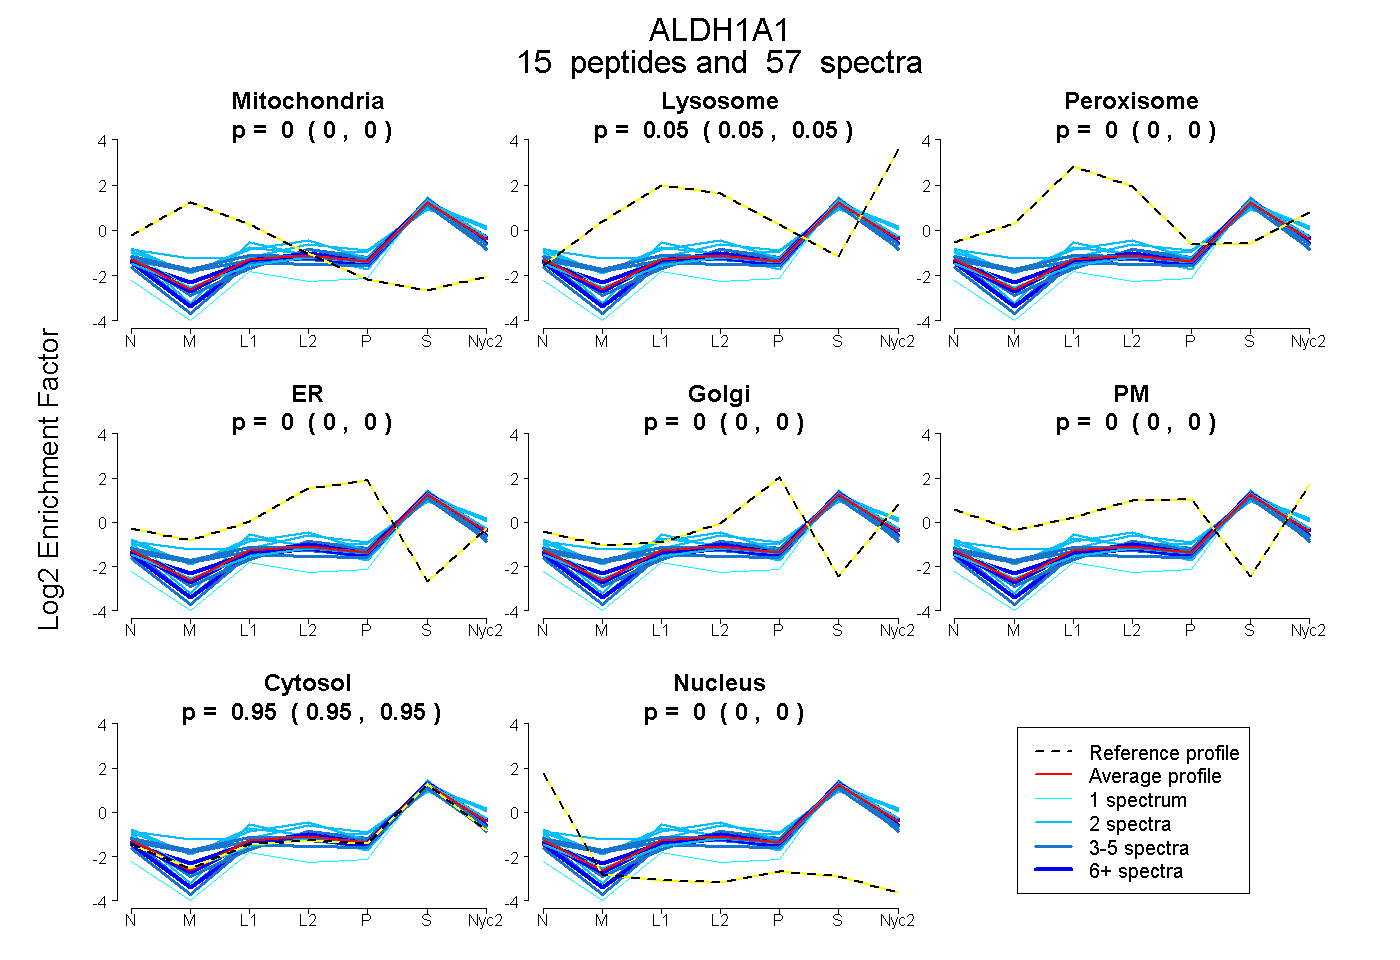
0.000 | 0.000
0.046 | 0.052
0.000 | 0.000
0.000 | 0.000
0.000 | 0.000
0.000 | 0.000
0.947 | 0.954
0.000 | 0.000
4peptides
spectra
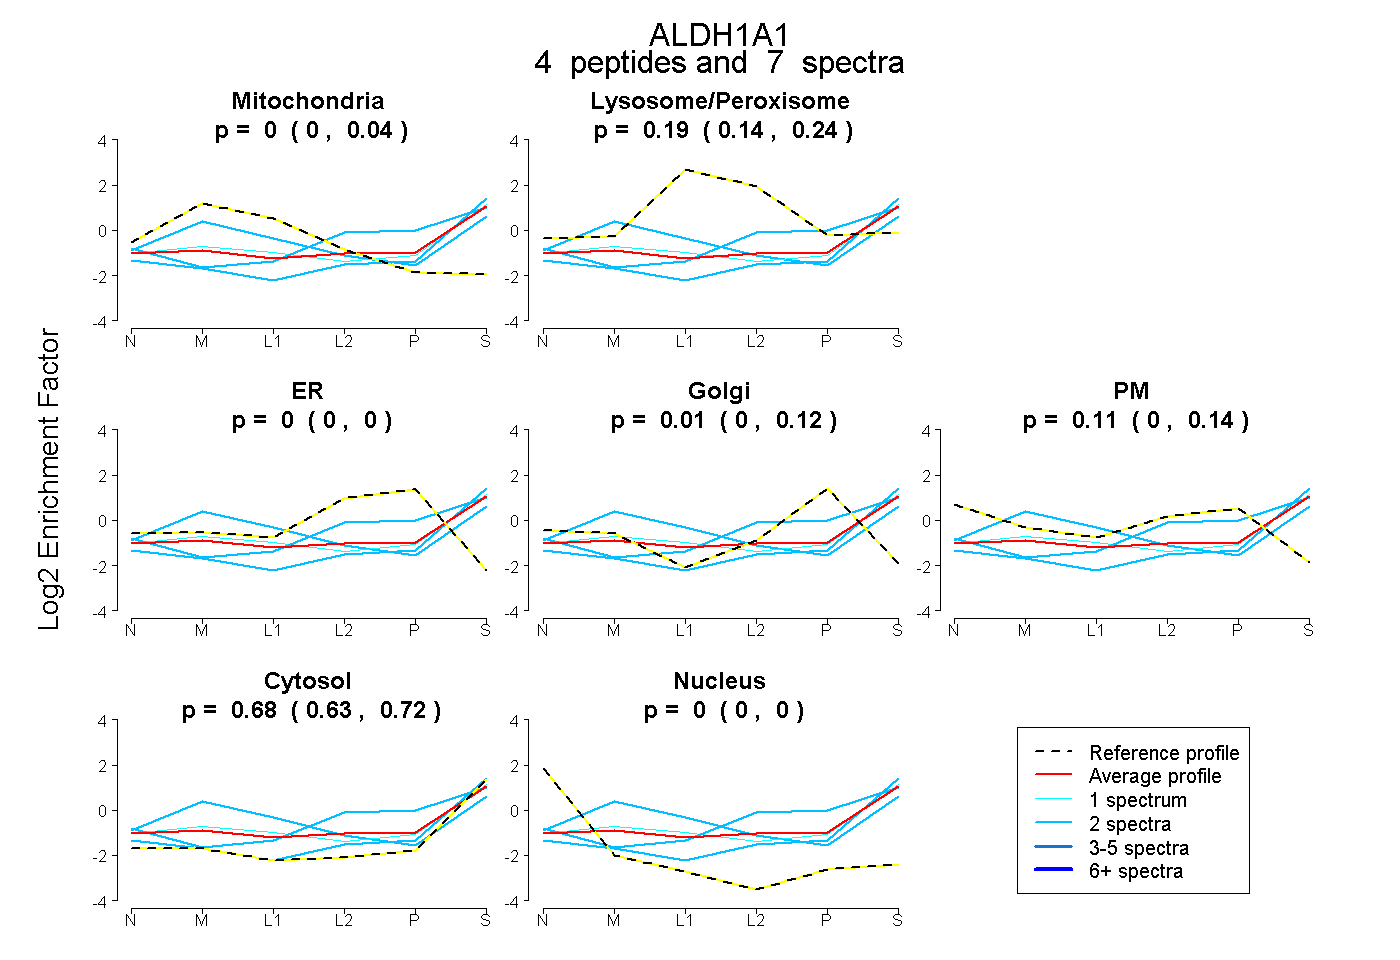
0.000 | 0.045
0.139 | 0.244
0.000 | 0.000
0.000 | 0.120
0.000 | 0.143
0.632 | 0.718
0.000 | 0.000
12peptides
spectra
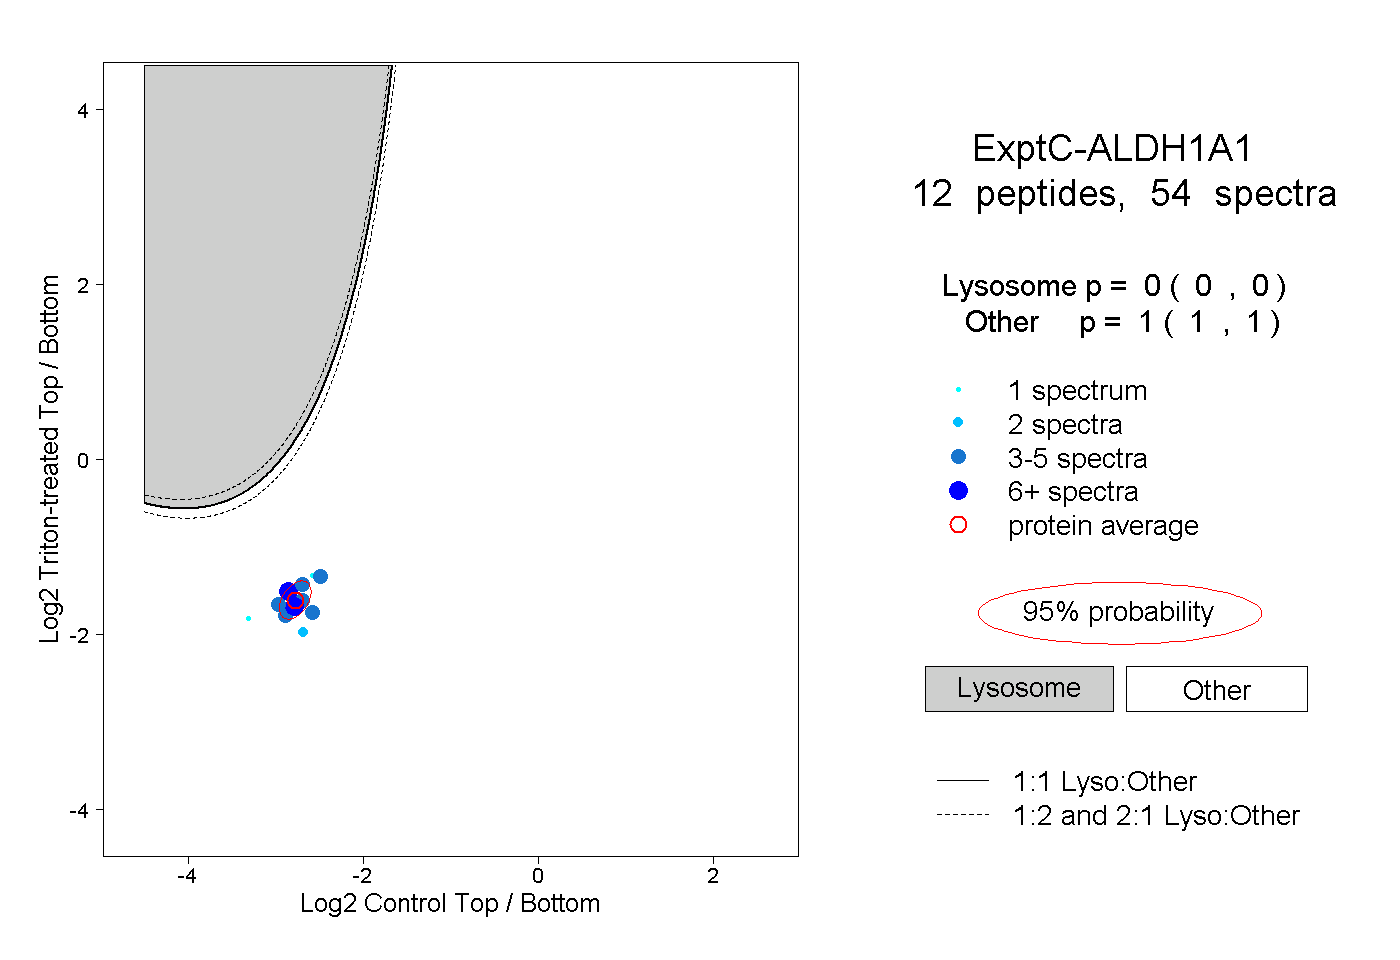
0.000 | 0.000
1.000 | 1.000
2peptides
spectra
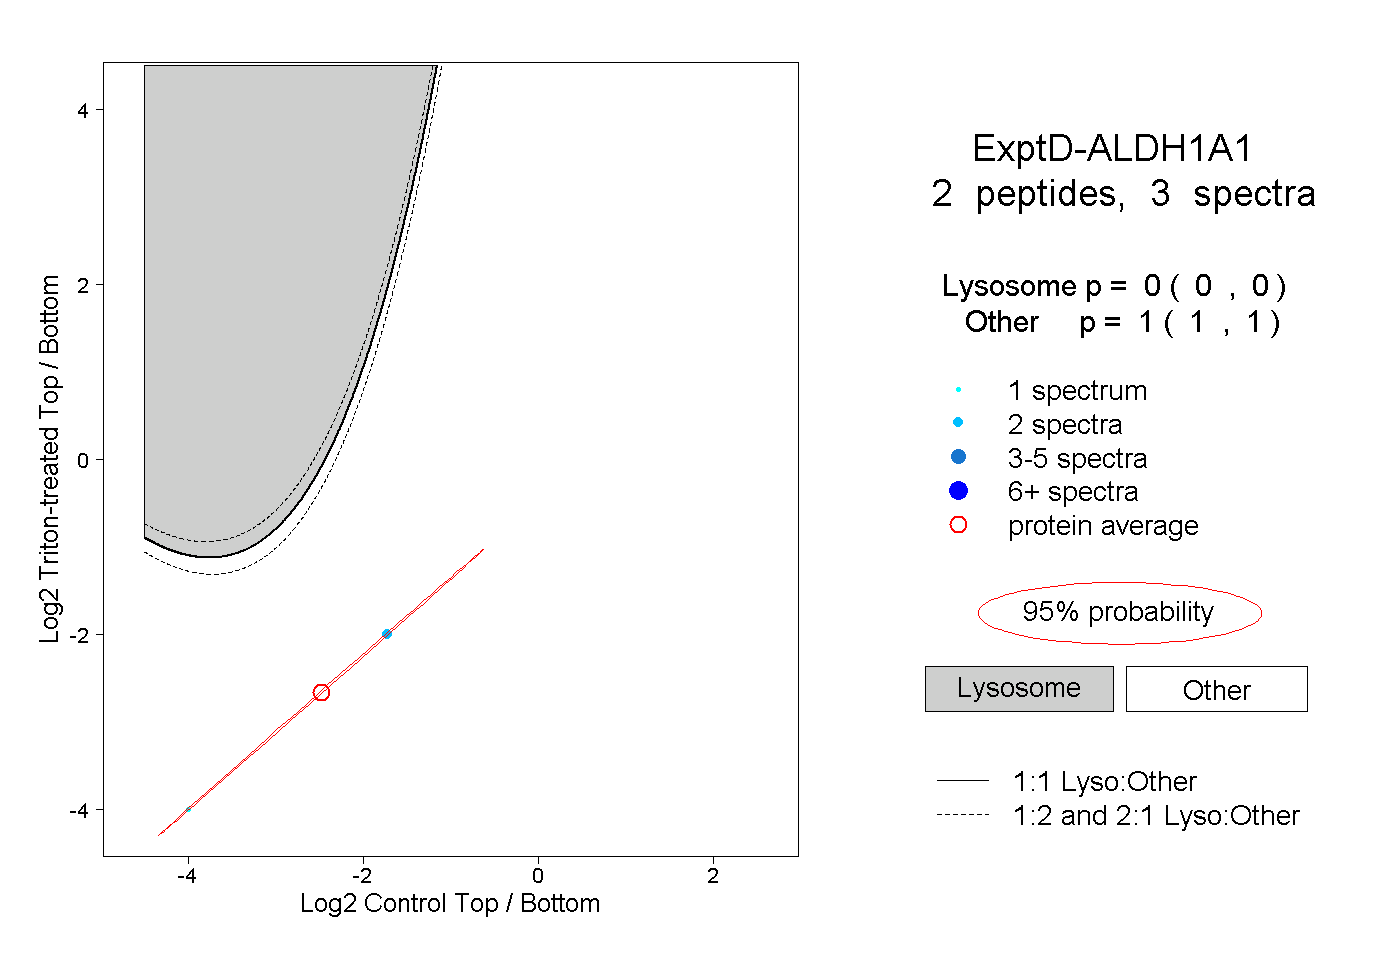
0.000 | 0.000
1.000 | 1.000