 4
4peptides
spectra
0.228 | 0.347
0.000 | 0.000
0.023 | 0.149
0.000 | 0.083
0.009 | 0.282
0.000 | 0.276
0.244 | 0.364
0.000 | 0.048
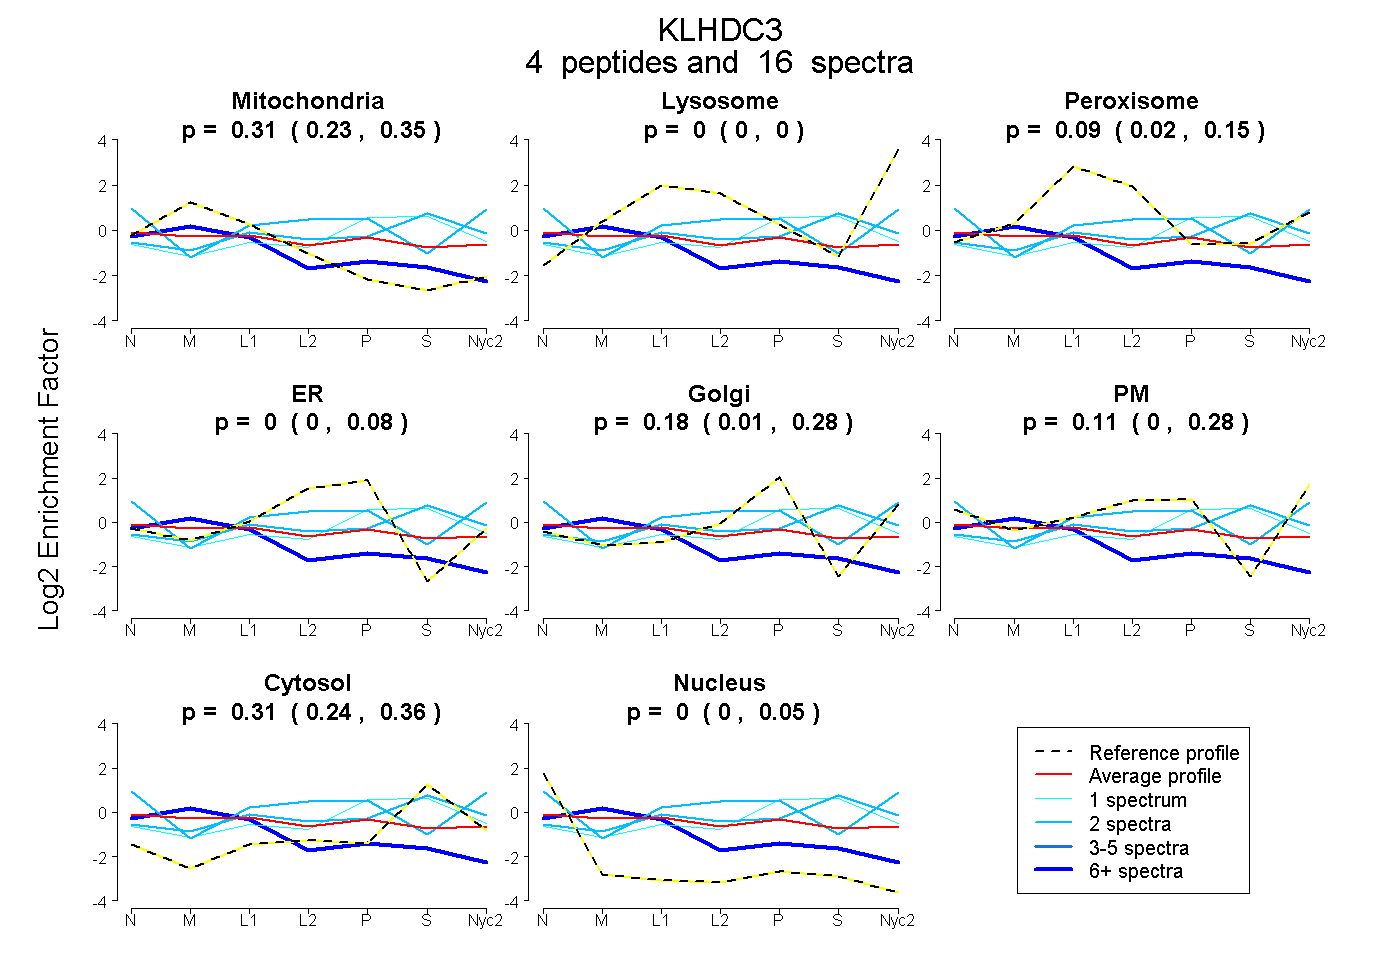
| Plot | Mito | Lyso | Perox | ER | Golgi | PM | Cytosol | Nucleus | |||||
| Expt A |
4 peptides |
16 spectra |
|
0.306 0.228 | 0.347 |
0.000 0.000 | 0.000 |
0.087 0.023 | 0.149 |
0.000 0.000 | 0.083 |
0.180 0.009 | 0.282 |
0.113 0.000 | 0.276 |
0.314 0.244 | 0.364 |
0.000 0.000 | 0.048 |
| 11 spectra, LPPVRPAVR | 0.656 | 0.000 | 0.000 | 0.000 | 0.039 | 0.000 | 0.198 | 0.106 | ||
| 1 spectrum, TEAWLDCPHTPVLPEGR | 0.000 | 0.000 | 0.135 | 0.000 | 0.316 | 0.000 | 0.549 | 0.000 | ||
| 2 spectra, VNHAAVAVGHR | 0.000 | 0.000 | 0.093 | 0.000 | 0.000 | 0.669 | 0.208 | 0.030 | ||
| 2 spectra, VSGTVPGAR | 0.002 | 0.000 | 0.303 | 0.000 | 0.122 | 0.020 | 0.552 | 0.000 |