 6
6peptides
spectra
0.000 | 0.000
0.756 | 0.885
0.000 | 0.091
0.000 | 0.107
0.000 | 0.000
0.000 | 0.000
0.048 | 0.146
0.000 | 0.000
| Plot | Mito | Lyso | Perox | ER | Golgi | PM | Cytosol | Nucleus | |||||
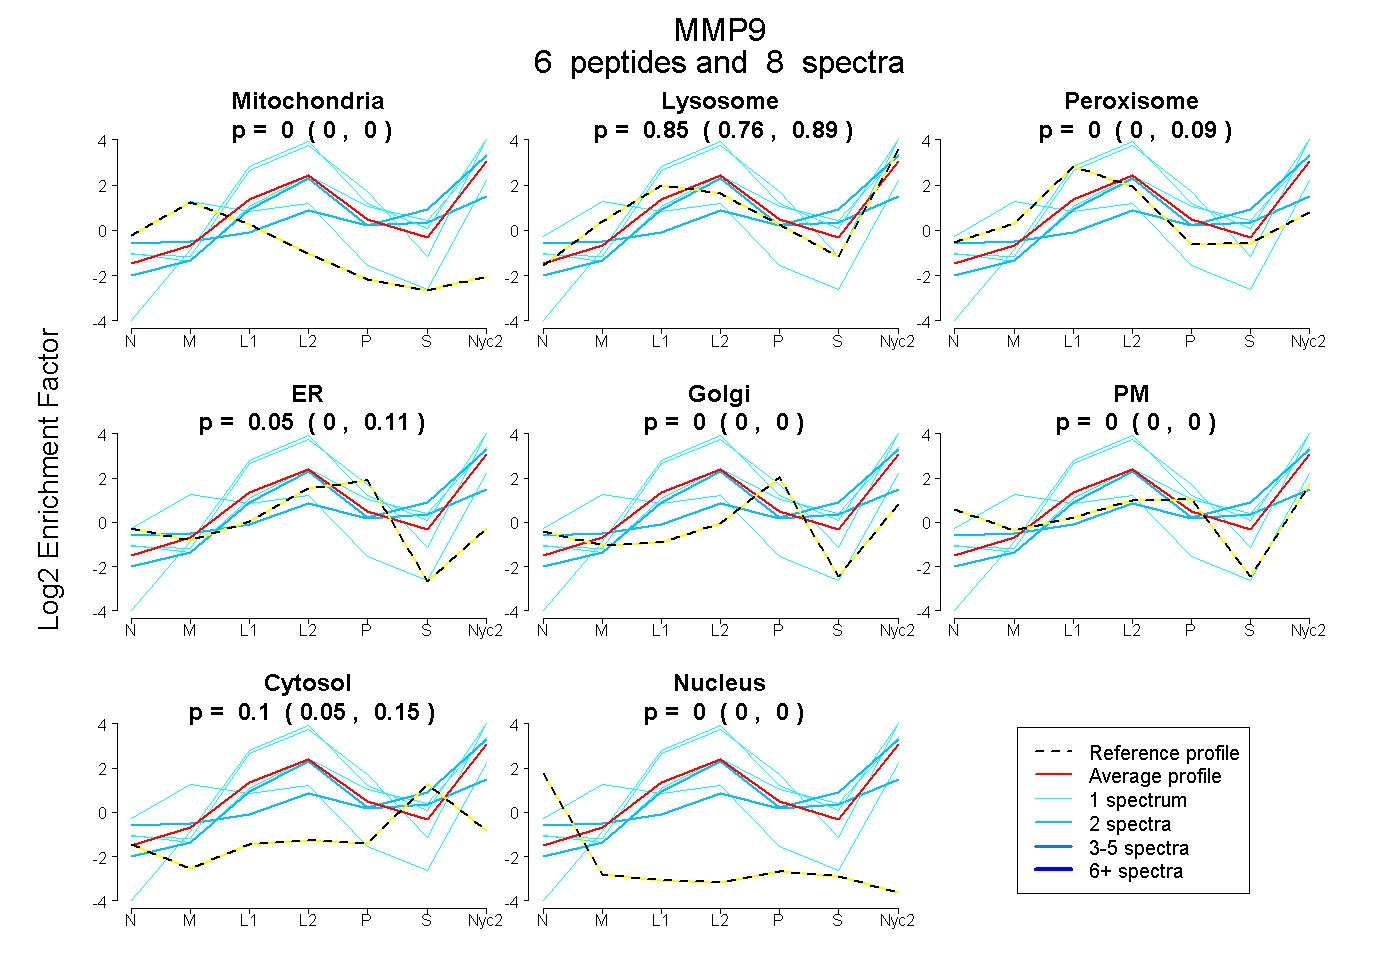
| Expt A |
6 peptides |
8 spectra |
|
0.000 0.000 | 0.000 |
0.848 0.756 | 0.885 |
0.000 0.000 | 0.091 |
0.049 0.000 | 0.107 |
0.000 0.000 | 0.000 |
0.000 0.000 | 0.000 |
0.103 0.048 | 0.146 |
0.000 0.000 | 0.000 |
| 1 spectrum, TWPALPAK | 0.000 | 0.814 | 0.000 | 0.032 | 0.000 | 0.000 | 0.154 | 0.000 | ||
| 1 spectrum, SYLSCTTDGR | 0.000 | 1.000 | 0.000 | 0.000 | 0.000 | 0.000 | 0.000 | 0.000 | ||
| 2 spectra, GIQHLYGR | 0.000 | 0.364 | 0.035 | 0.000 | 0.000 | 0.227 | 0.375 | 0.000 | ||
| 1 spectrum, DVIDDSFAR | 0.350 | 0.562 | 0.000 | 0.000 | 0.000 | 0.088 | 0.000 | 0.000 | ||
| 1 spectrum, QPTYVVFPR | 0.000 | 0.937 | 0.000 | 0.063 | 0.000 | 0.000 | 0.000 | 0.000 | ||
| 2 spectra, VDPQSVTR | 0.000 | 0.773 | 0.000 | 0.000 | 0.000 | 0.000 | 0.227 | 0.000 |
| Plot | Lyso | Other | |||||||||||
| Expt C |
10 peptides |
23 spectra |
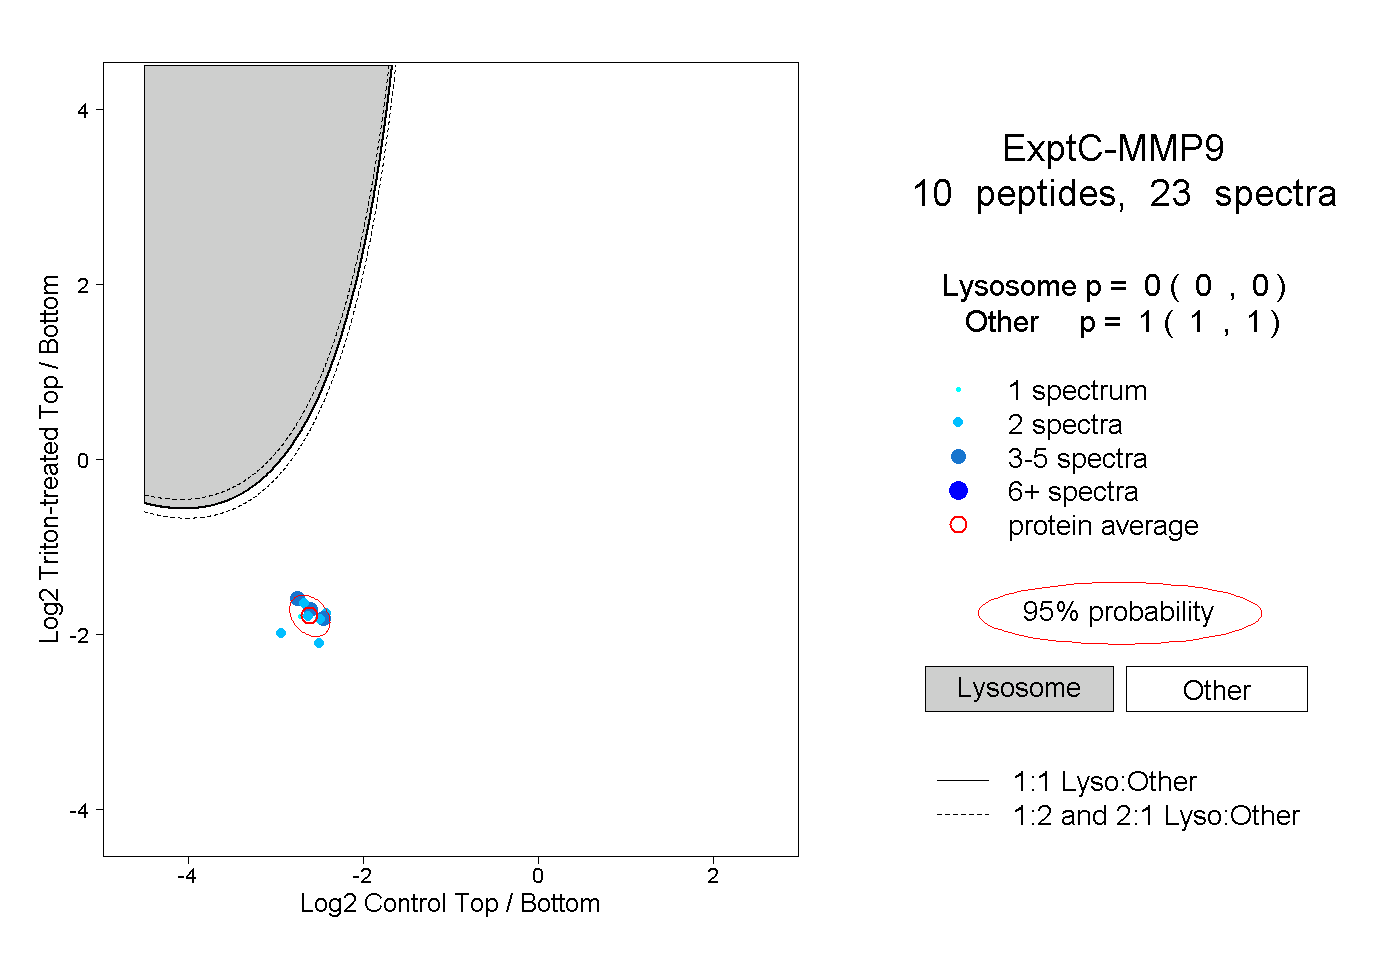 |
0.000 0.000 | 0.000 |
1.000 1.000 | 1.000 |
||||||||
| Plot | Lyso | Other | |||||||||||
| Expt D |
2 peptides |
4 spectra |
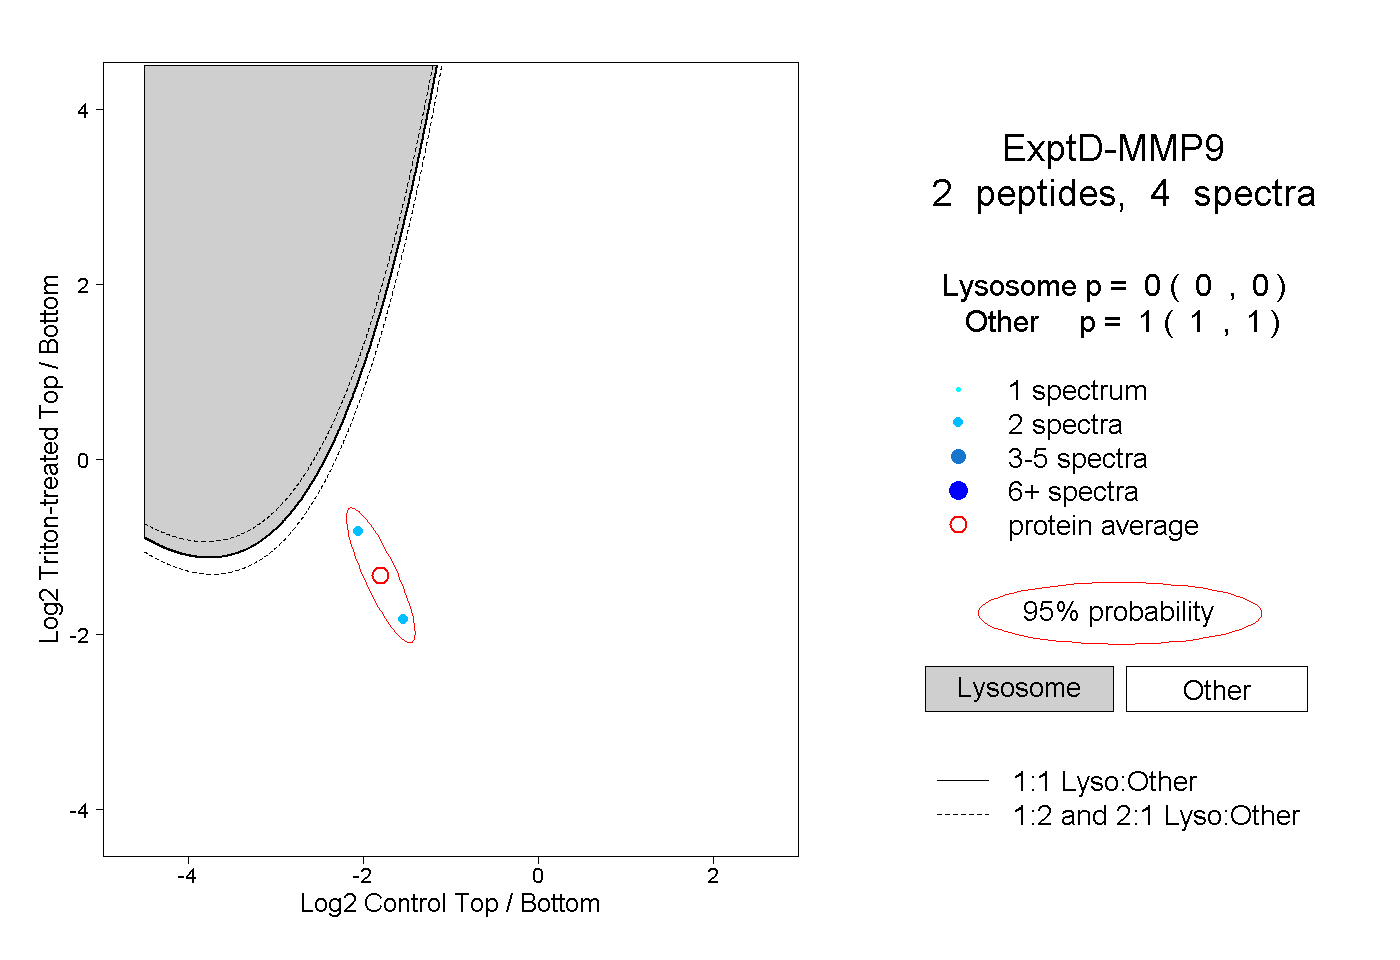 |
0.000 0.000 | 0.000 |
1.000 1.000 | 1.000 |