 4
4peptides
spectra
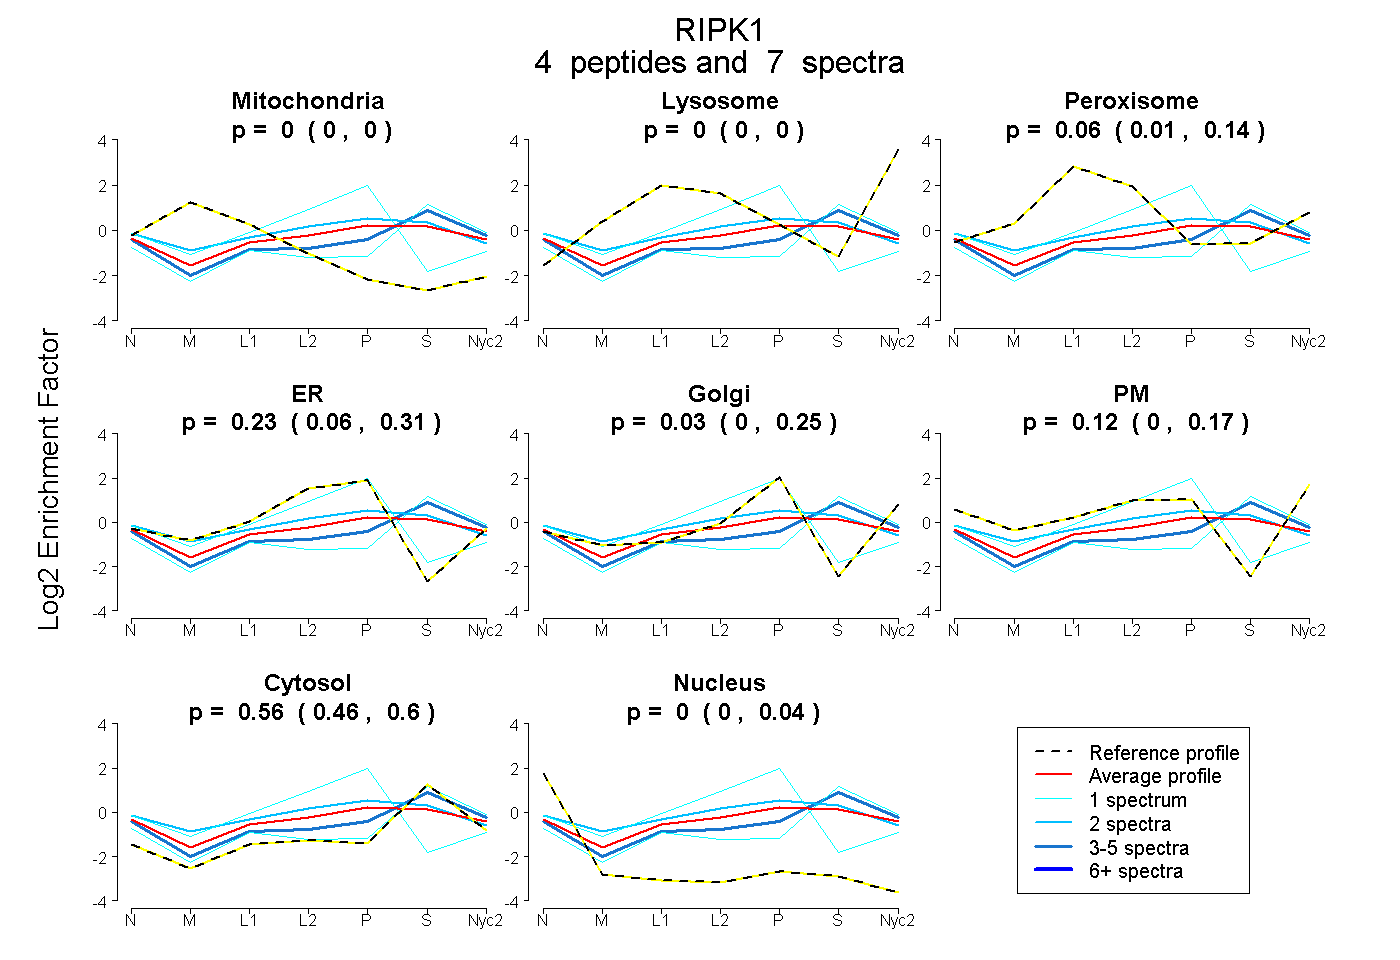
0.000 | 0.000
0.000 | 0.000
0.008 | 0.139
0.057 | 0.307
0.000 | 0.253
0.000 | 0.173
0.458 | 0.605
0.000 | 0.044
| Plot | Mito | Lyso | Perox | ER | Golgi | PM | Cytosol | Nucleus | |||||
| Expt A |
4 peptides |
7 spectra |
|
0.000 0.000 | 0.000 |
0.000 0.000 | 0.000 |
0.055 0.008 | 0.139 |
0.234 0.057 | 0.307 |
0.026 0.000 | 0.253 |
0.124 0.000 | 0.173 |
0.561 0.458 | 0.605 |
0.000 0.000 | 0.044 |
| 2 spectra, LAQALHQCCR | 0.000 | 0.000 | 0.157 | 0.341 | 0.000 | 0.033 | 0.469 | 0.000 | ||
| 1 spectrum, IADLGVASFK | 0.000 | 0.053 | 0.015 | 0.000 | 0.000 | 0.072 | 0.859 | 0.000 | ||
| 1 spectrum, QPDMSLDNIK | 0.000 | 0.000 | 0.000 | 0.858 | 0.000 | 0.000 | 0.119 | 0.023 | ||
| 3 spectra, AEYNEALLEEGK | 0.000 | 0.000 | 0.016 | 0.000 | 0.000 | 0.235 | 0.750 | 0.000 |
| Plot | Lyso | Other | |||||||||||
| Expt C |
4 peptides |
7 spectra |
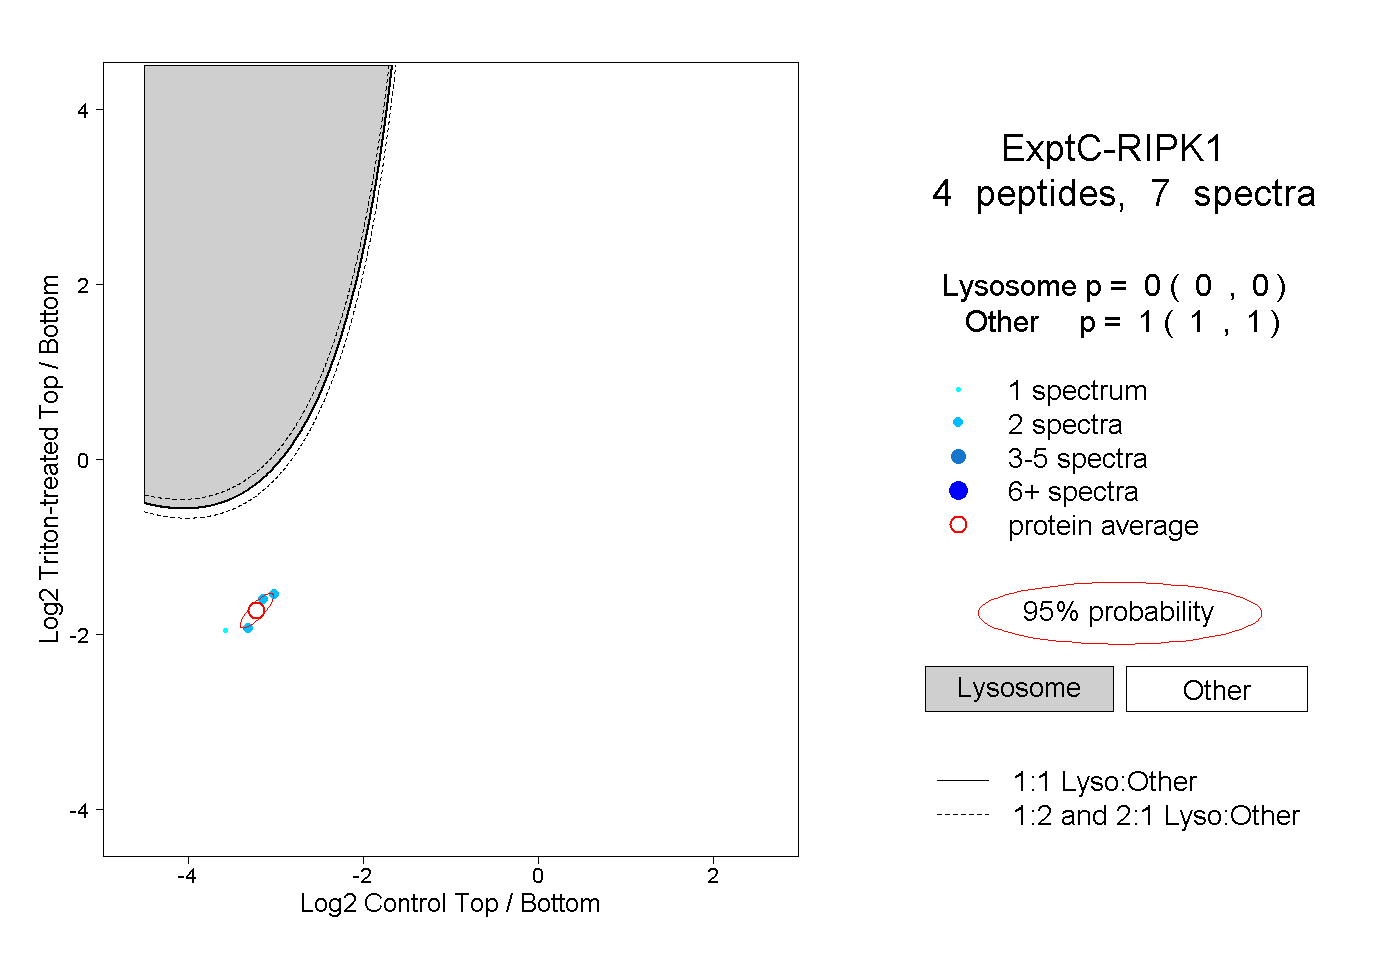 |
0.000 0.000 | 0.000 |
1.000 1.000 | 1.000 |