9
9peptides
spectra
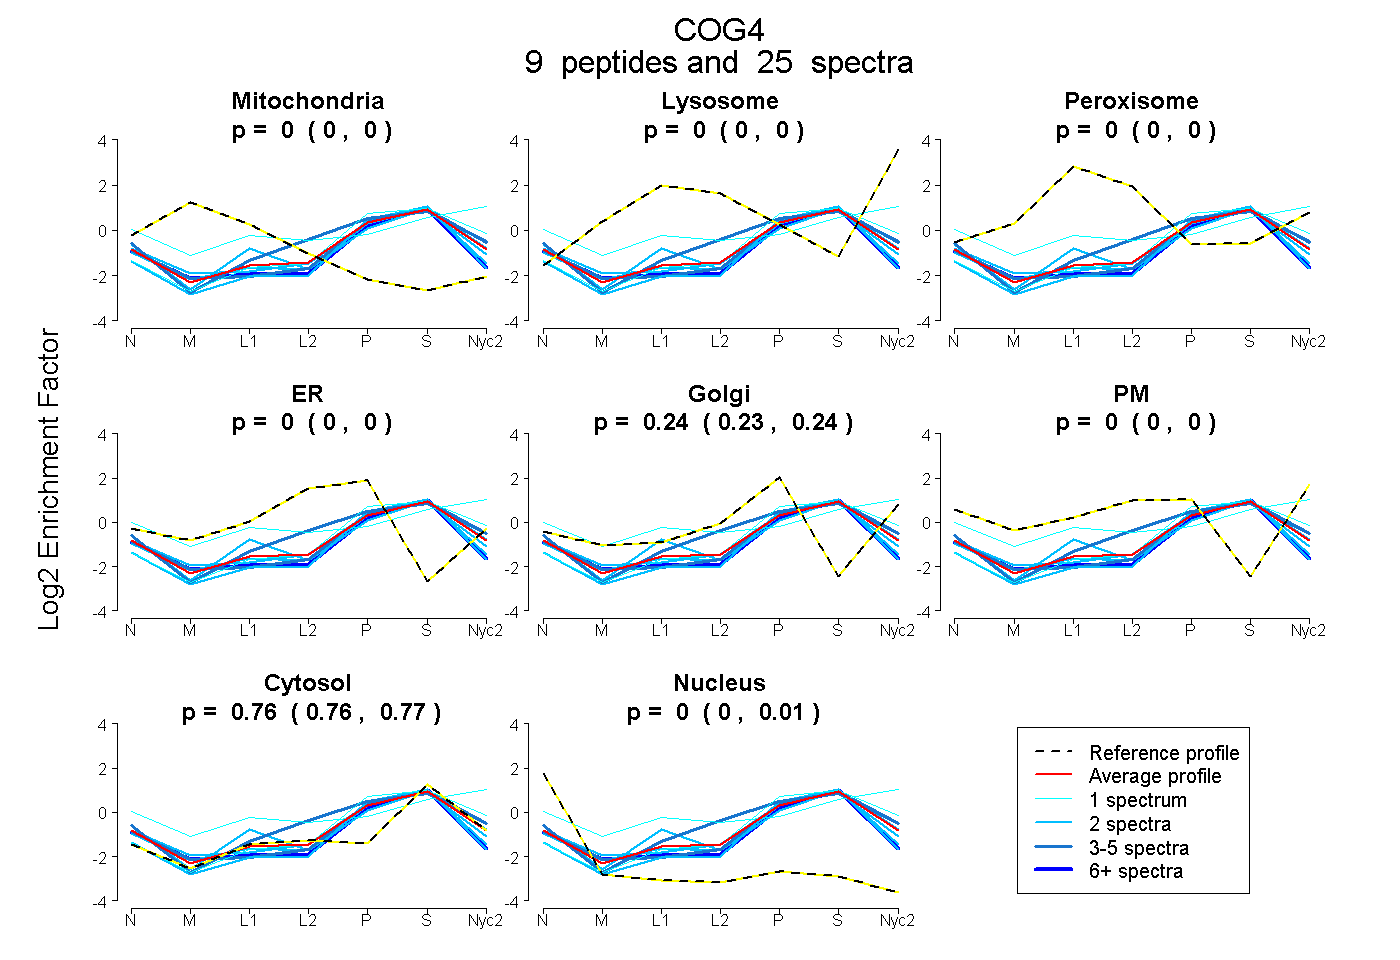
0.000 | 0.000
0.000 | 0.000
0.000 | 0.000
0.000 | 0.000
0.228 | 0.243
0.000 | 0.000
0.755 | 0.766
0.000 | 0.009
3peptides
spectra
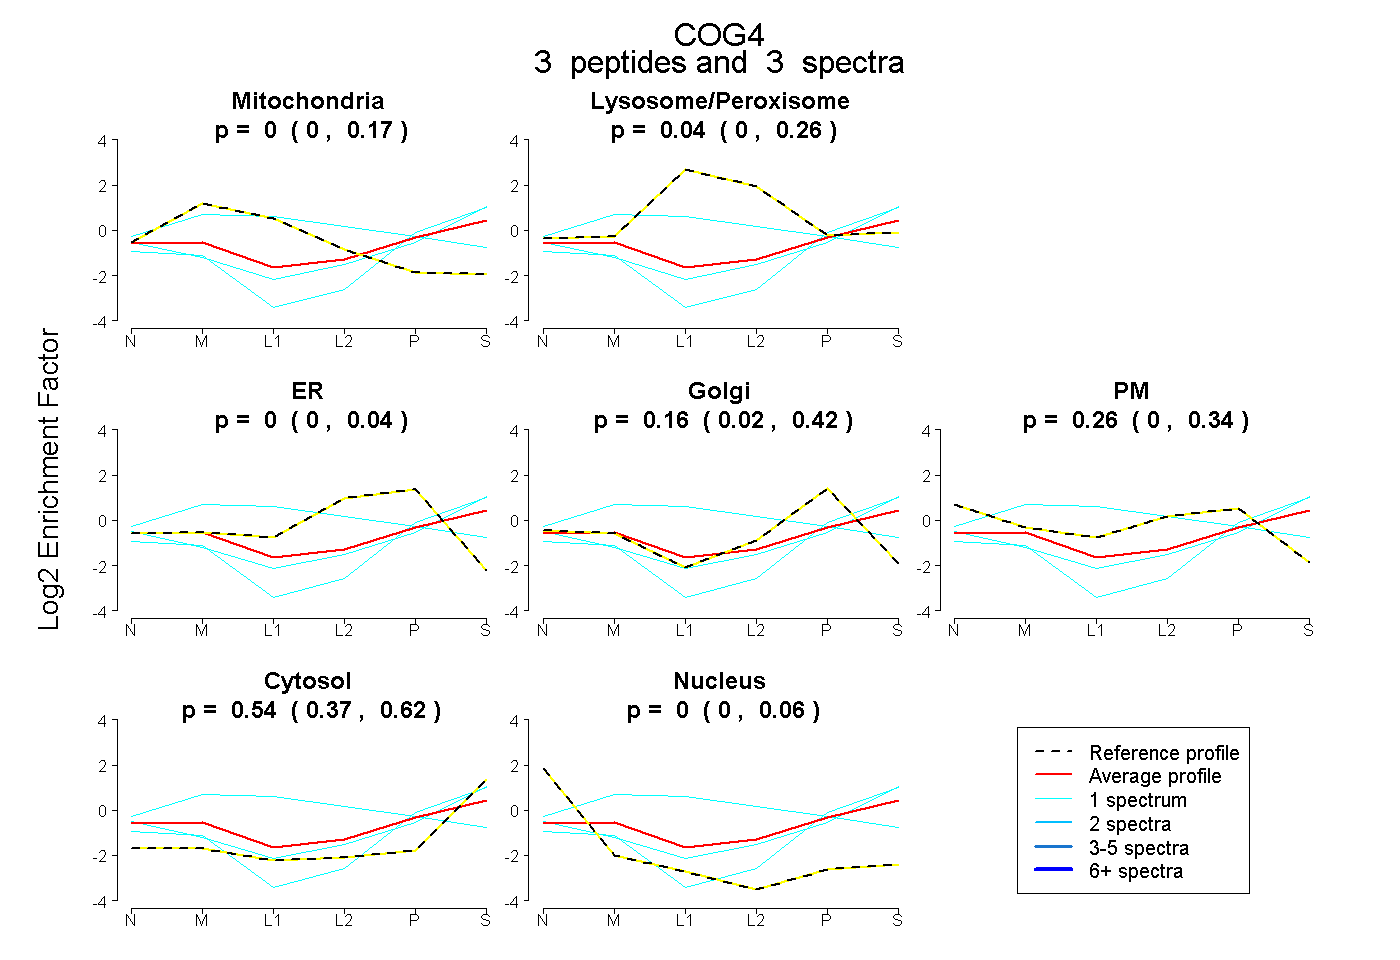
0.000 | 0.174
0.000 | 0.256
0.000 | 0.044
0.019 | 0.416
0.000 | 0.337
0.374 | 0.617
0.000 | 0.062