 4
4peptides
spectra
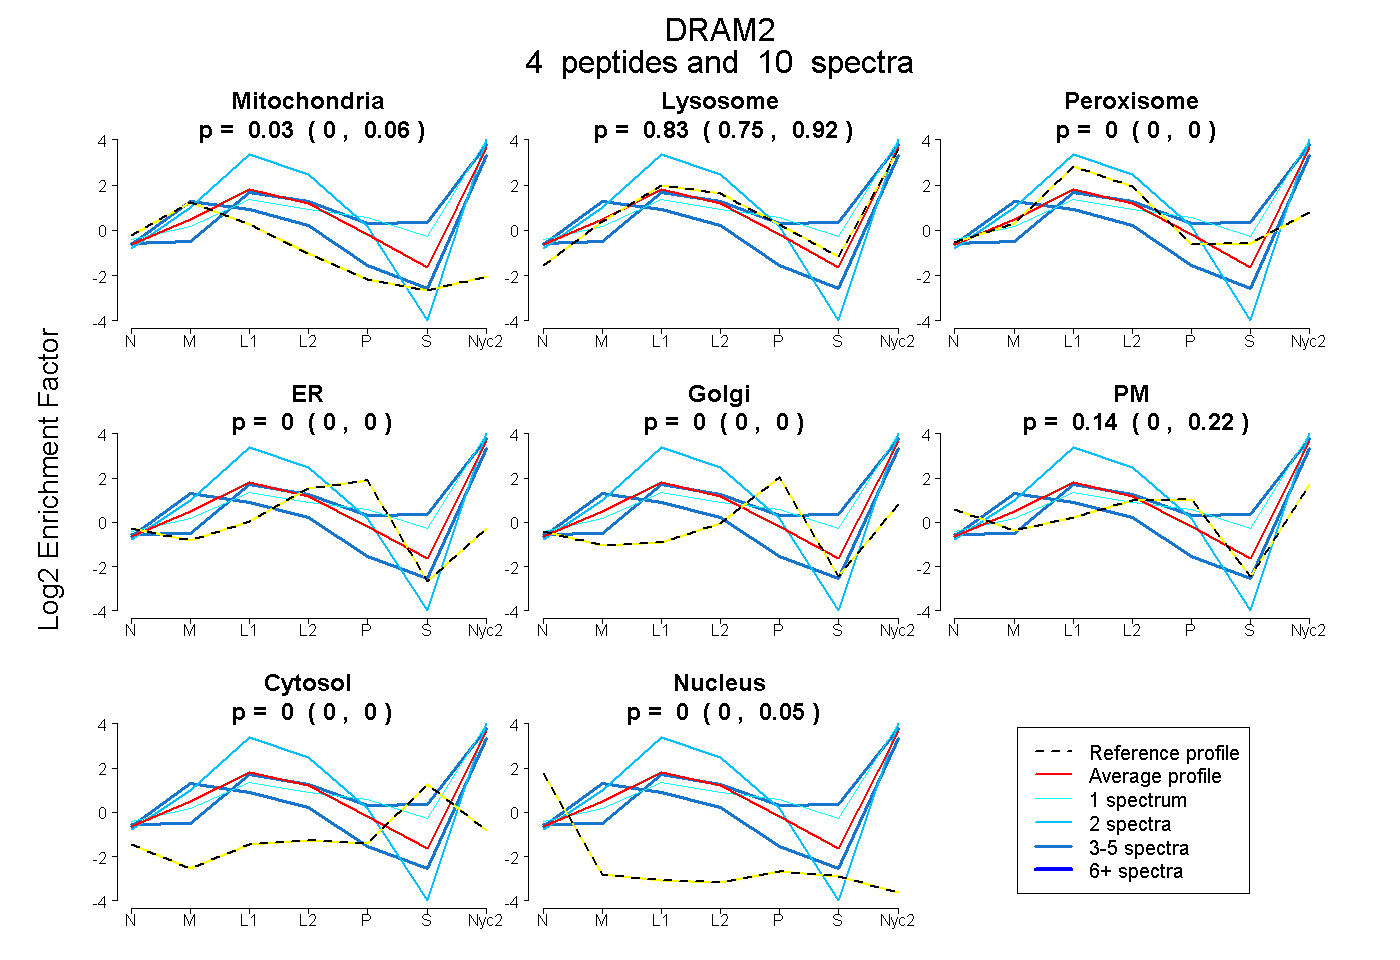
0.000 | 0.059
0.750 | 0.924
0.000 | 0.004
0.000 | 0.000
0.000 | 0.000
0.000 | 0.219
0.000 | 0.000
0.000 | 0.050
3peptides
spectra
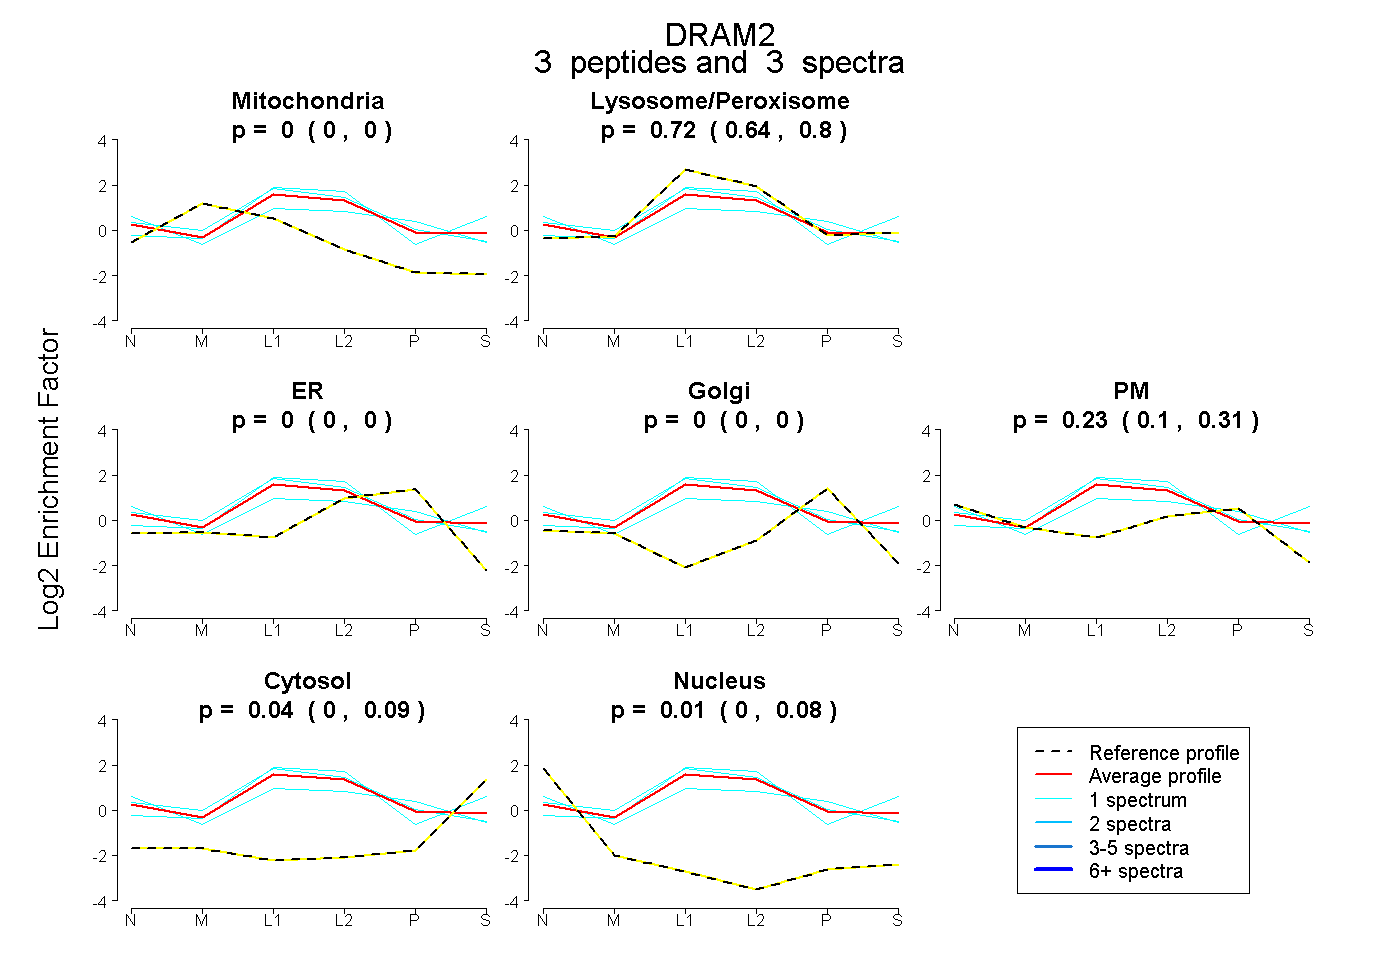
0.000 | 0.000
0.640 | 0.798
0.000 | 0.000
0.000 | 0.000
0.095 | 0.308
0.000 | 0.094
0.000 | 0.076
4peptides
spectra
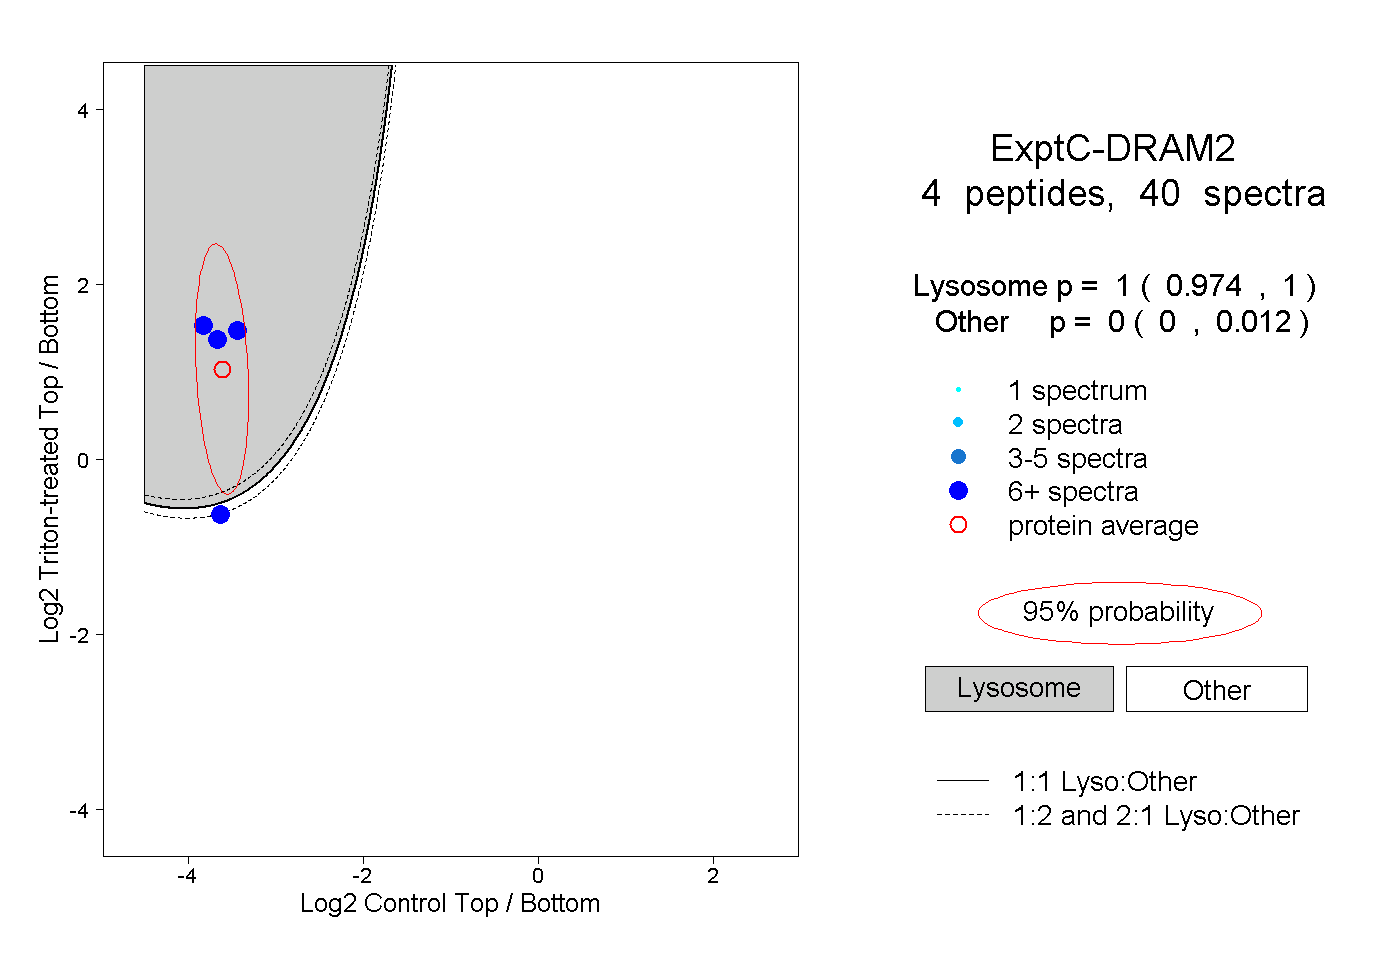
0.974 | 1.000
0.000 | 0.012
1peptide
spectra
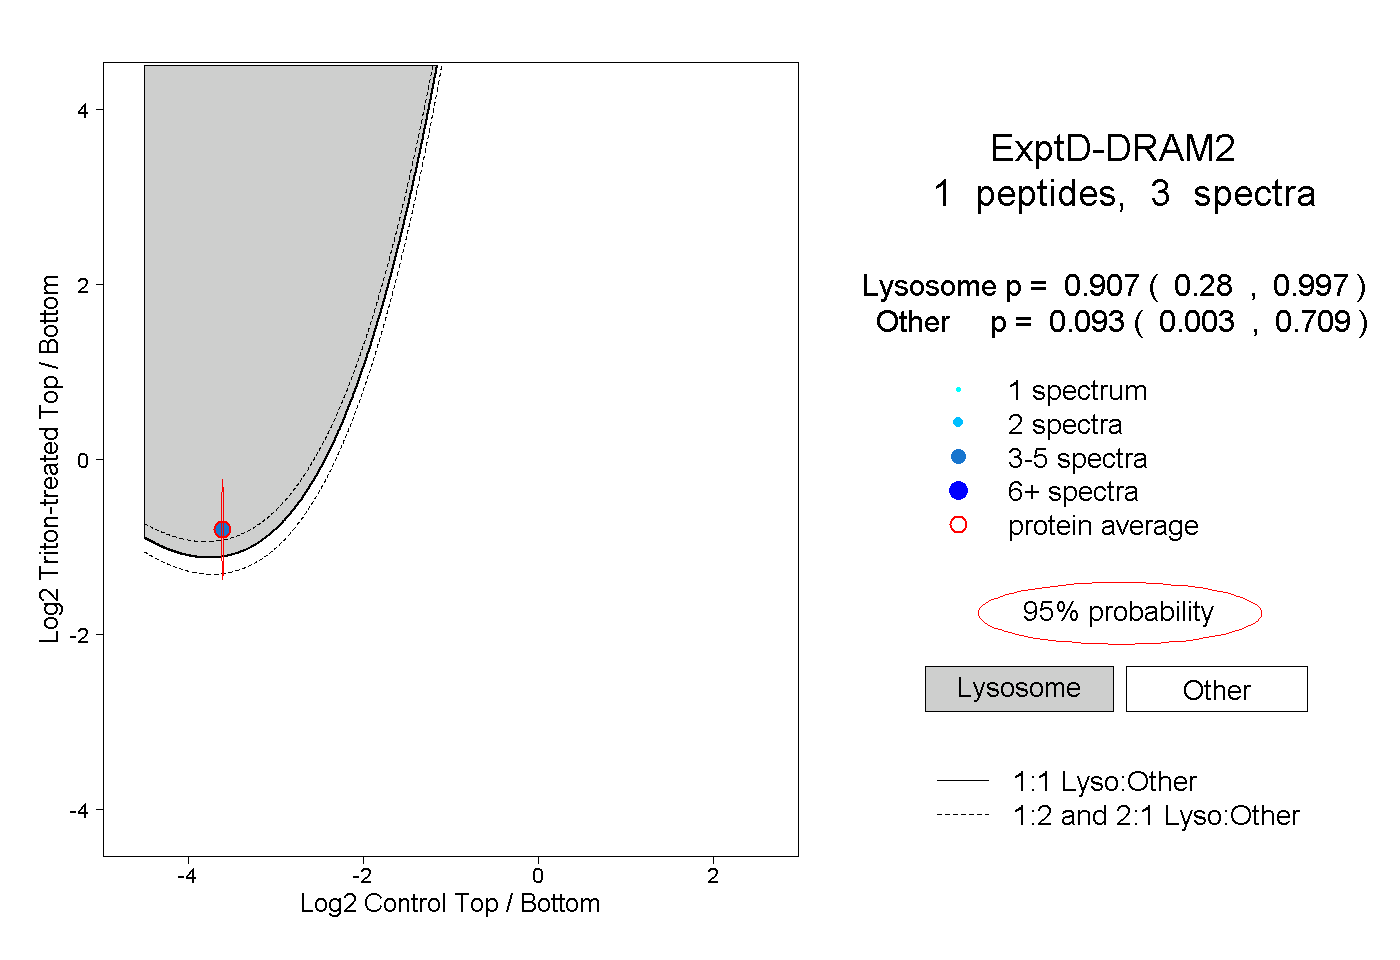
0.280 | 0.997
0.003 | 0.709