 22
22peptides
spectra
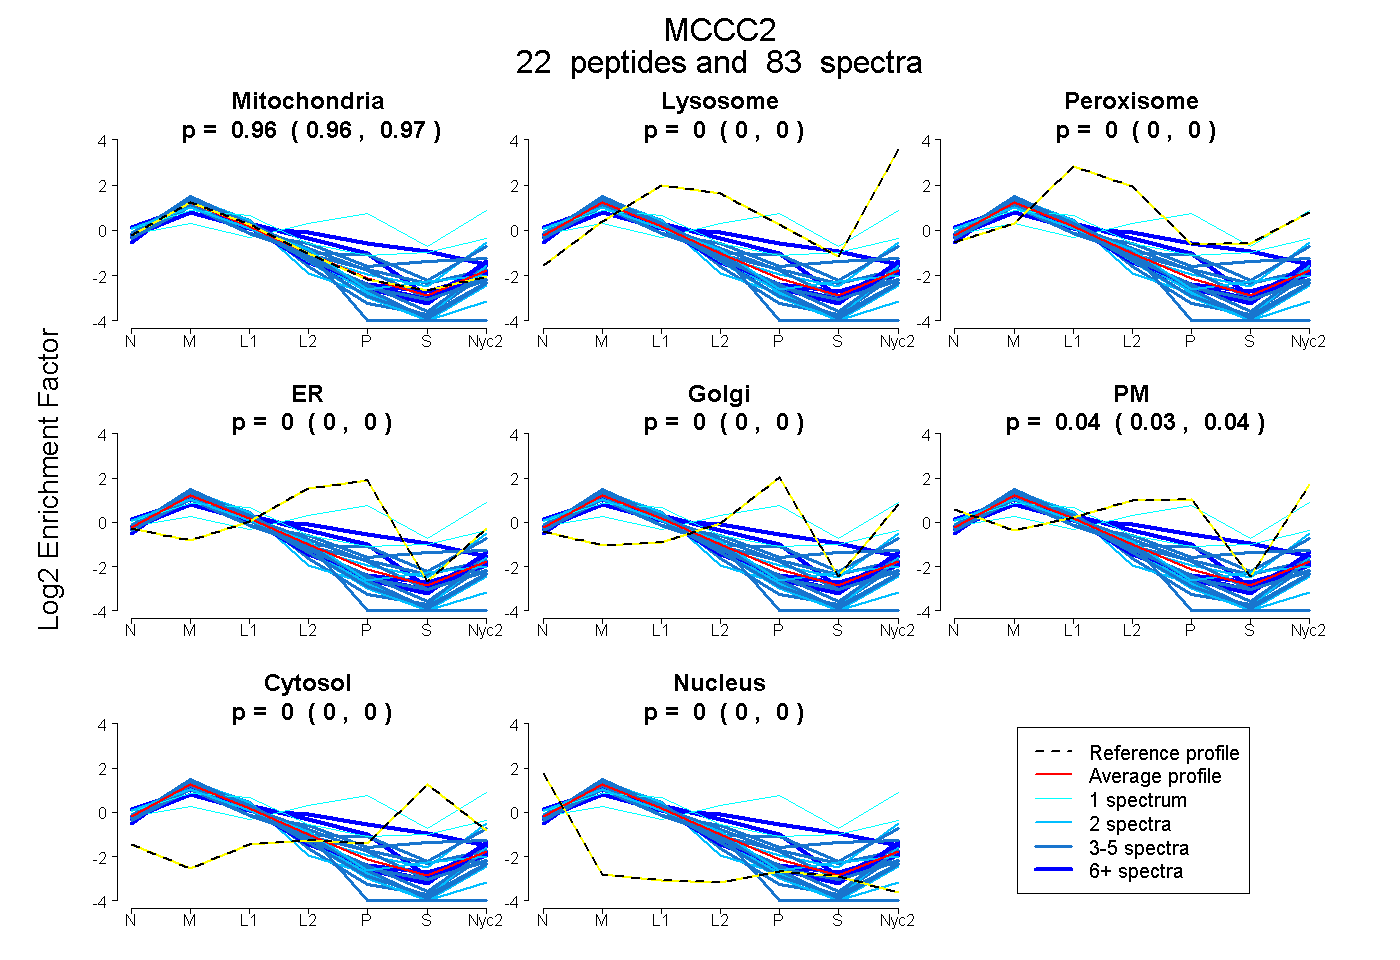
0.956 | 0.966
0.000 | 0.000
0.000 | 0.000
0.000 | 0.000
0.000 | 0.000
0.030 | 0.041
0.000 | 0.000
0.001 | 0.005
15peptides
spectra
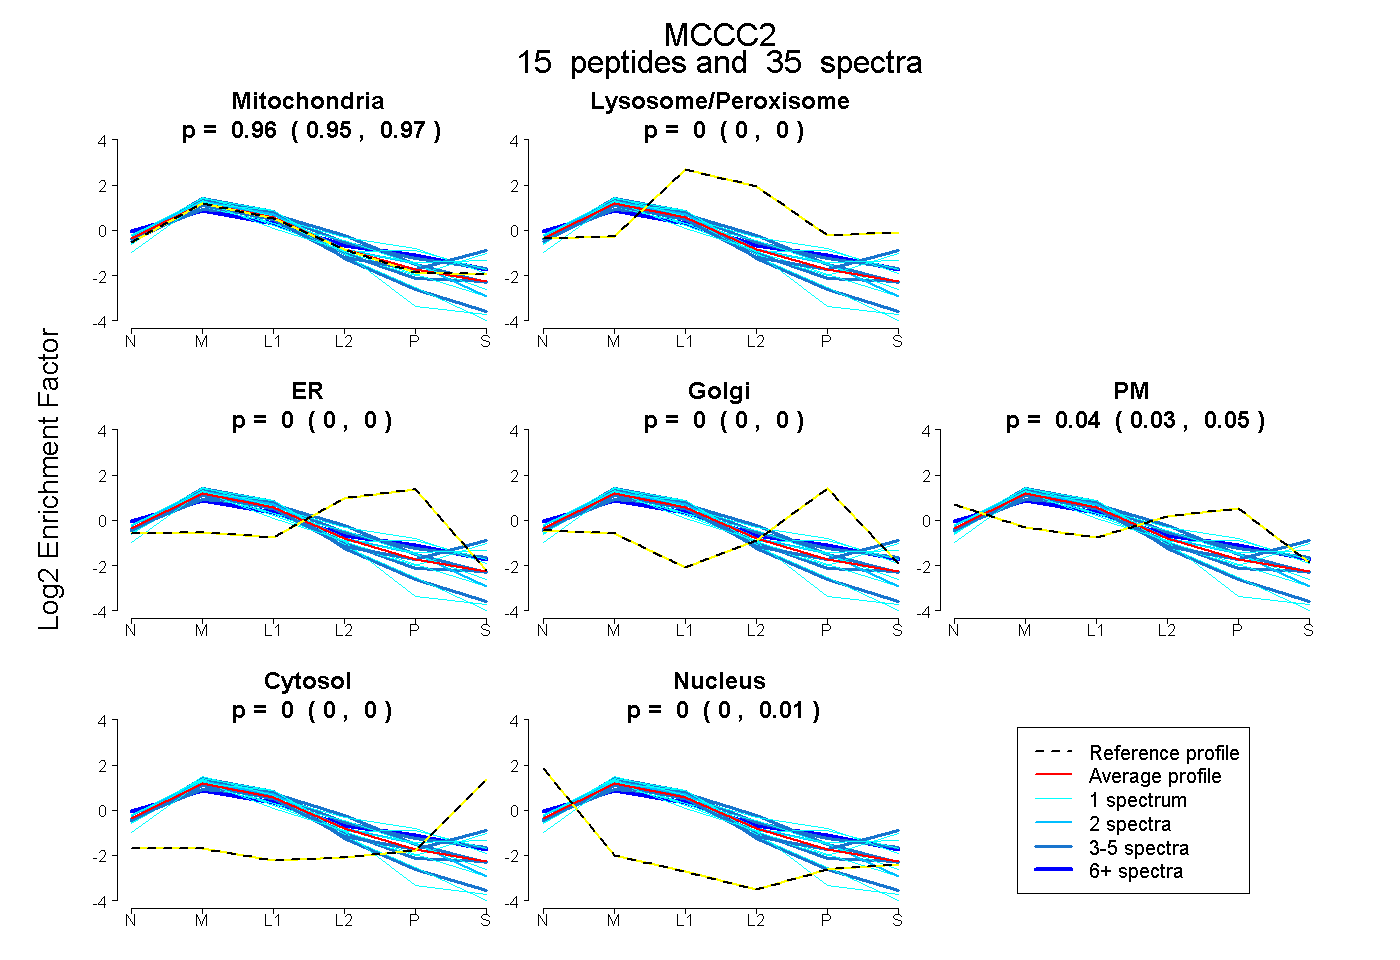
0.947 | 0.968
0.000 | 0.000
0.000 | 0.000
0.000 | 0.000
0.026 | 0.050
0.000 | 0.000
0.000 | 0.006
27peptides
spectra
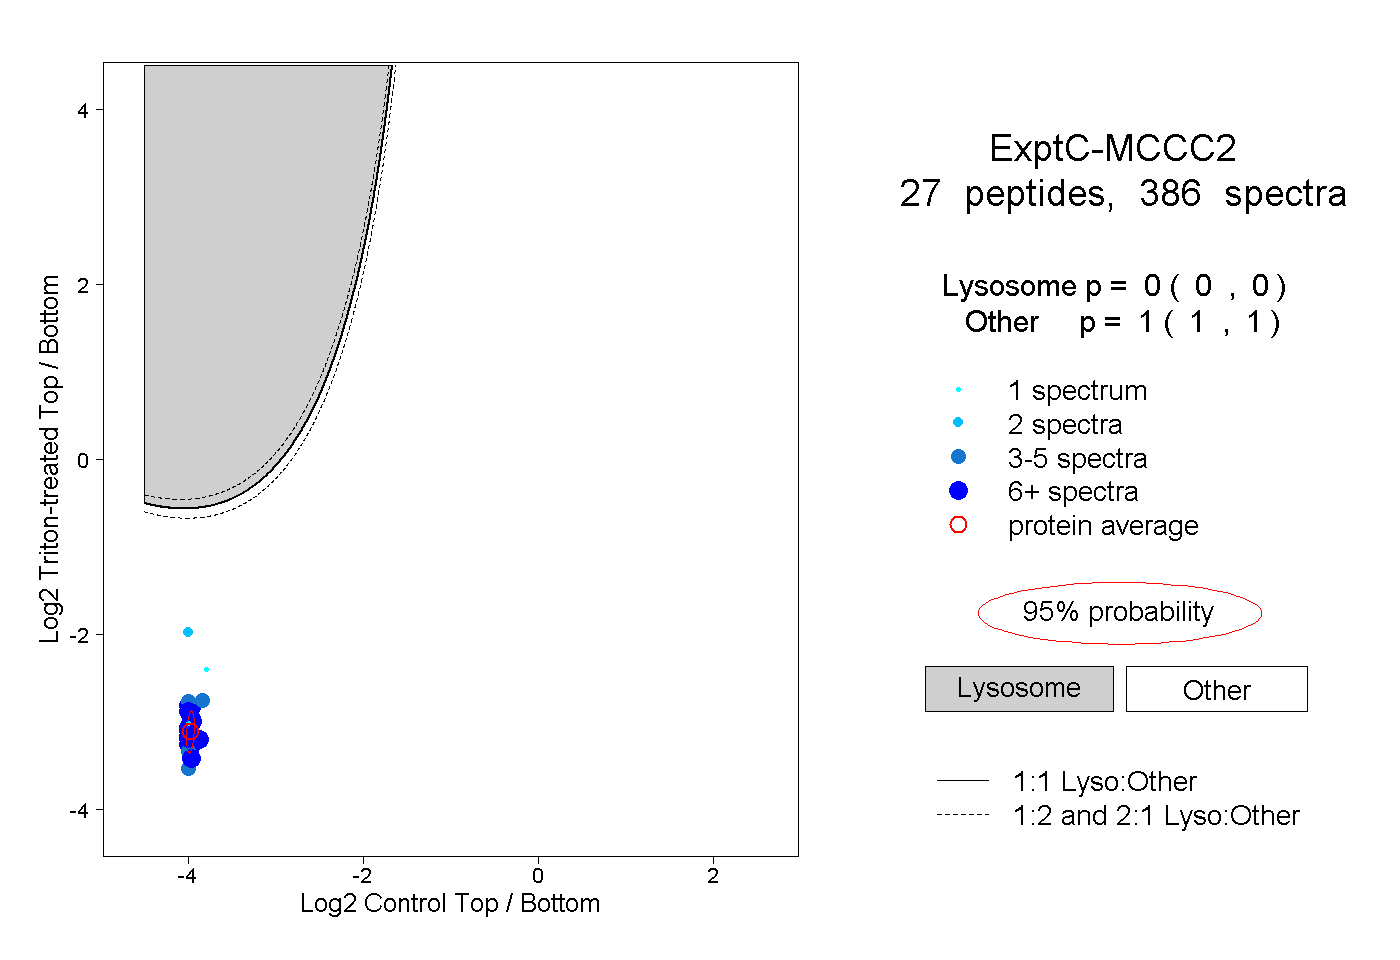
0.000 | 0.000
1.000 | 1.000
14peptides
spectra
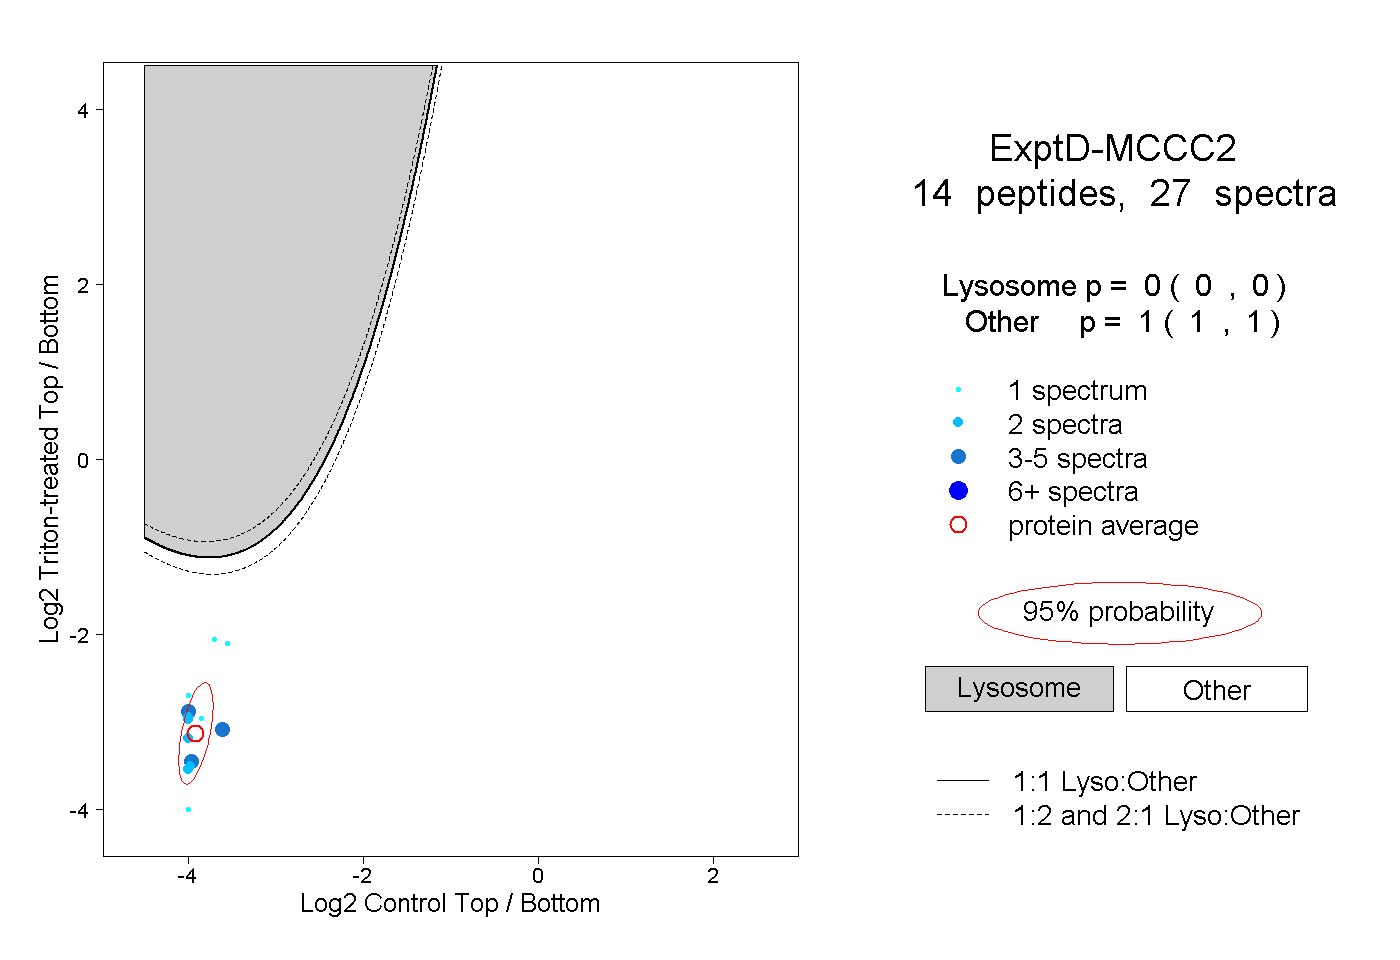
0.000 | 0.000
1.000 | 1.000