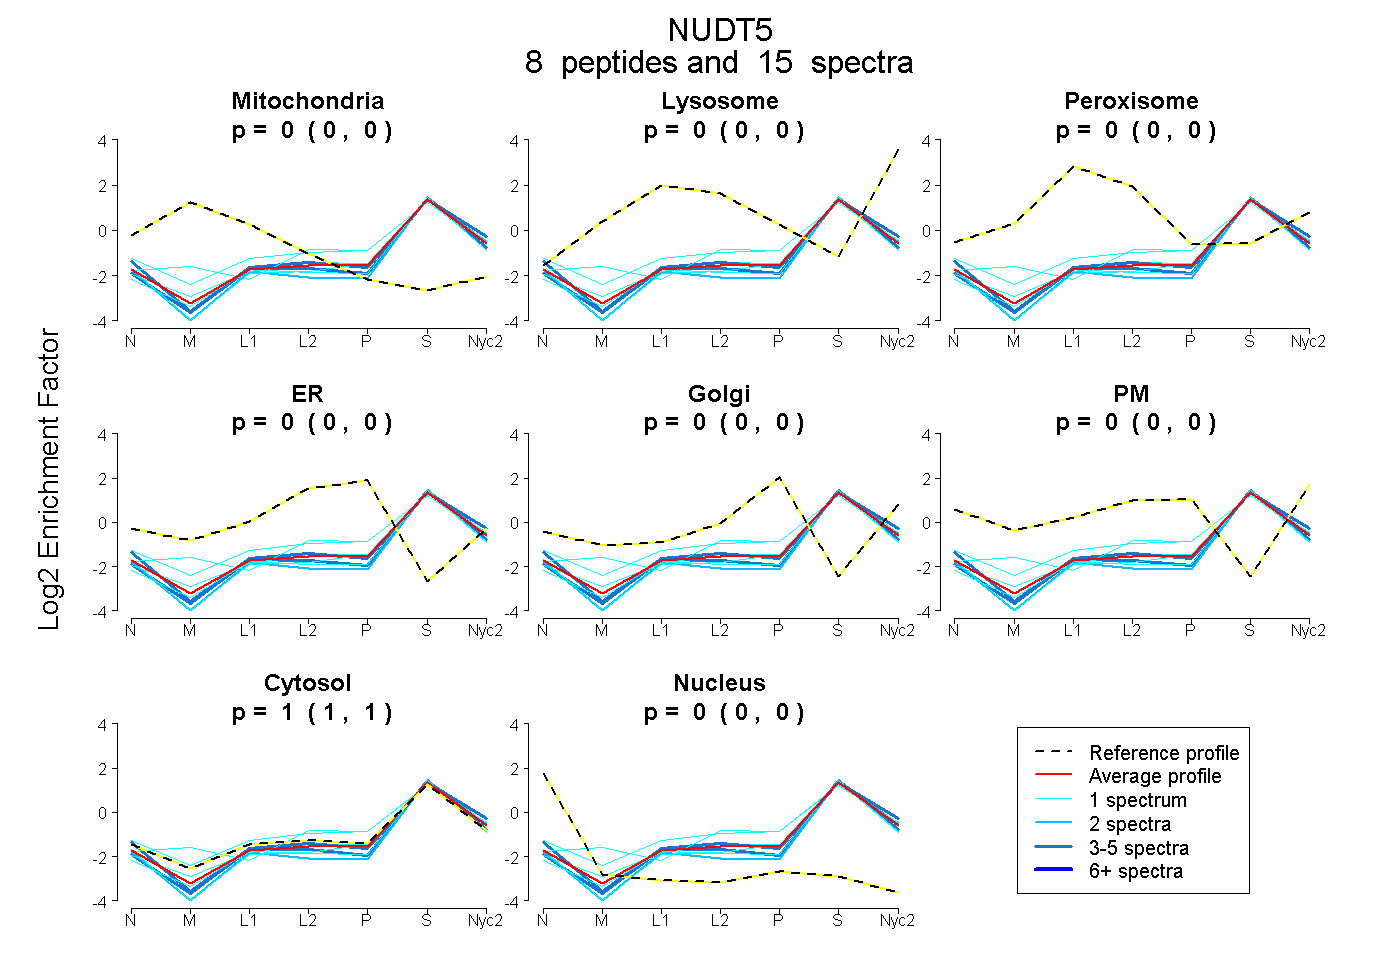
 8
8peptides
spectra
0.000 | 0.000
0.000 | 0.000
0.000 | 0.000
0.000 | 0.000
0.000 | 0.000
0.000 | 0.000
1.000 | 1.000
0.000 | 0.000
| Plot | Mito | Lyso | Perox | ER | Golgi | PM | Cytosol | Nucleus | |||||
| Expt A |
8 peptides |
15 spectra |
|
0.000 0.000 | 0.000 |
0.000 0.000 | 0.000 |
0.000 0.000 | 0.000 |
0.000 0.000 | 0.000 |
0.000 0.000 | 0.000 |
0.000 0.000 | 0.000 |
1.000 1.000 | 1.000 |
0.000 0.000 | 0.000 |
| 1 spectrum, VYAYALALK | 0.000 | 0.026 | 0.000 | 0.000 | 0.086 | 0.000 | 0.888 | 0.000 | ||
| 2 spectra, ELEEETGYK | 0.000 | 0.000 | 0.000 | 0.000 | 0.000 | 0.000 | 0.981 | 0.019 | ||
| 1 spectrum, TTYMDPTGK | 0.000 | 0.000 | 0.000 | 0.000 | 0.000 | 0.000 | 1.000 | 0.000 | ||
| 4 spectra, DSSPPTEQR | 0.000 | 0.000 | 0.000 | 0.000 | 0.000 | 0.000 | 1.000 | 0.000 | ||
| 1 spectrum, ILSEELISEGK | 0.000 | 0.000 | 0.000 | 0.000 | 0.000 | 0.000 | 1.000 | 0.000 | ||
| 1 spectrum, TLHHECIVLVK | 0.000 | 0.035 | 0.000 | 0.030 | 0.028 | 0.000 | 0.907 | 0.000 | ||
| 1 spectrum, SADAVSVIPVLQR | 0.000 | 0.000 | 0.000 | 0.000 | 0.000 | 0.000 | 0.994 | 0.006 | ||
| 4 spectra, LDALGAEDR | 0.000 | 0.000 | 0.000 | 0.000 | 0.000 | 0.000 | 1.000 | 0.000 |
| Plot | Mito | Lyso or Perox | ER | Golgi | PM | Cytosol | Nucleus | ||||||
| Expt B |
3 peptides |
4 spectra |
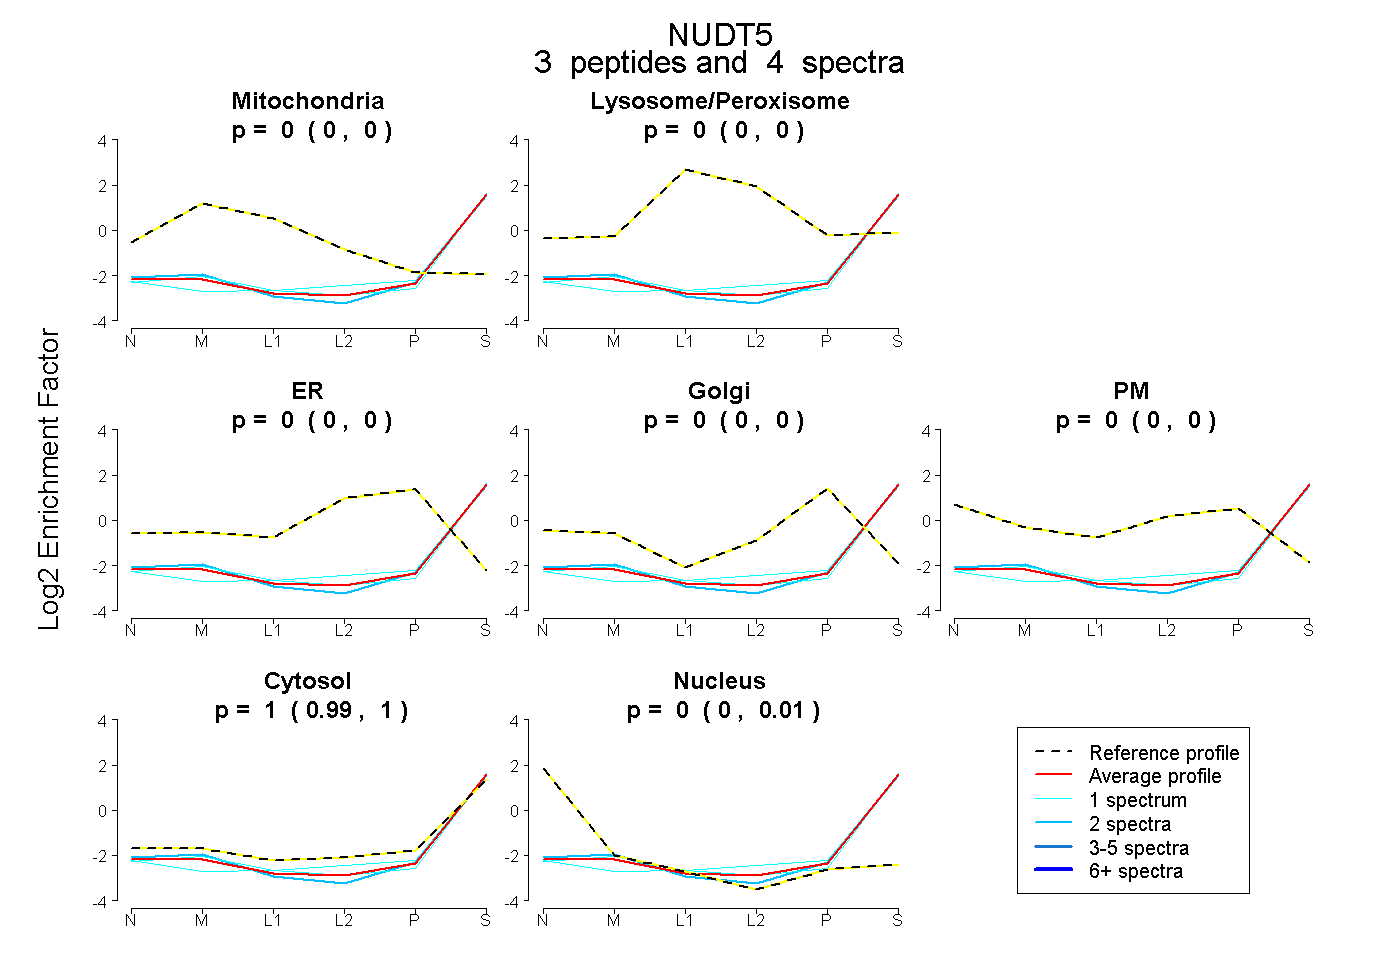 |
0.000 0.000 | 0.000 |
0.000 0.000 | 0.000 |
0.000 0.000 | 0.000 |
0.000 0.000 | 0.000 |
0.000 0.000 | 0.000 |
1.000 0.988 | 1.000 |
0.000 0.000 | 0.009 |
|||
| Plot | Lyso | Other | |||||||||||
| Expt C |
6 peptides |
13 spectra |
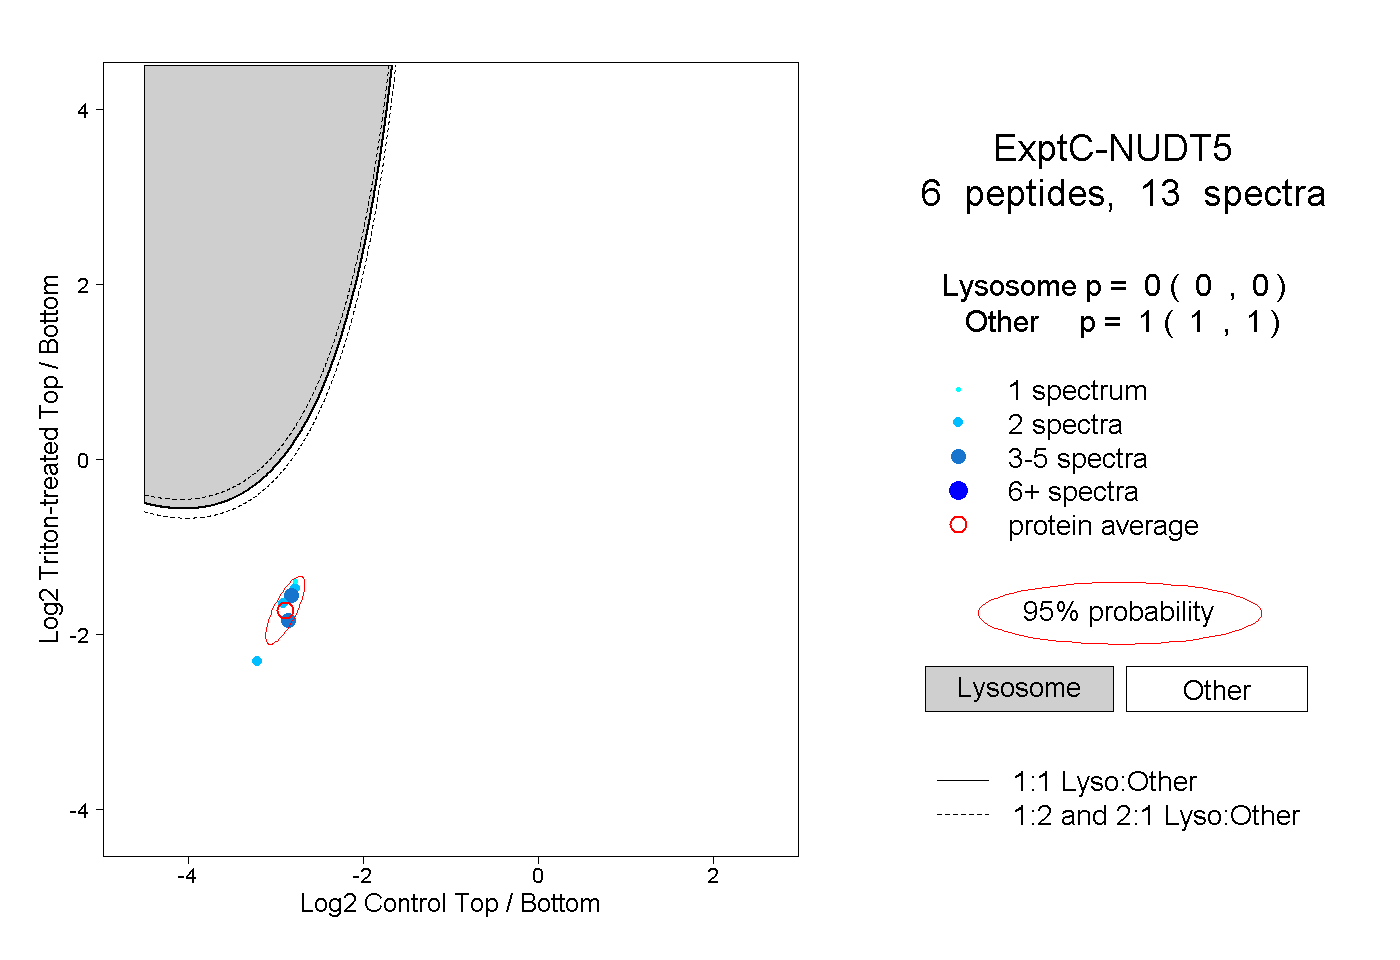 |
0.000 0.000 | 0.000 |
1.000 1.000 | 1.000 |