 1
1peptide
spectra
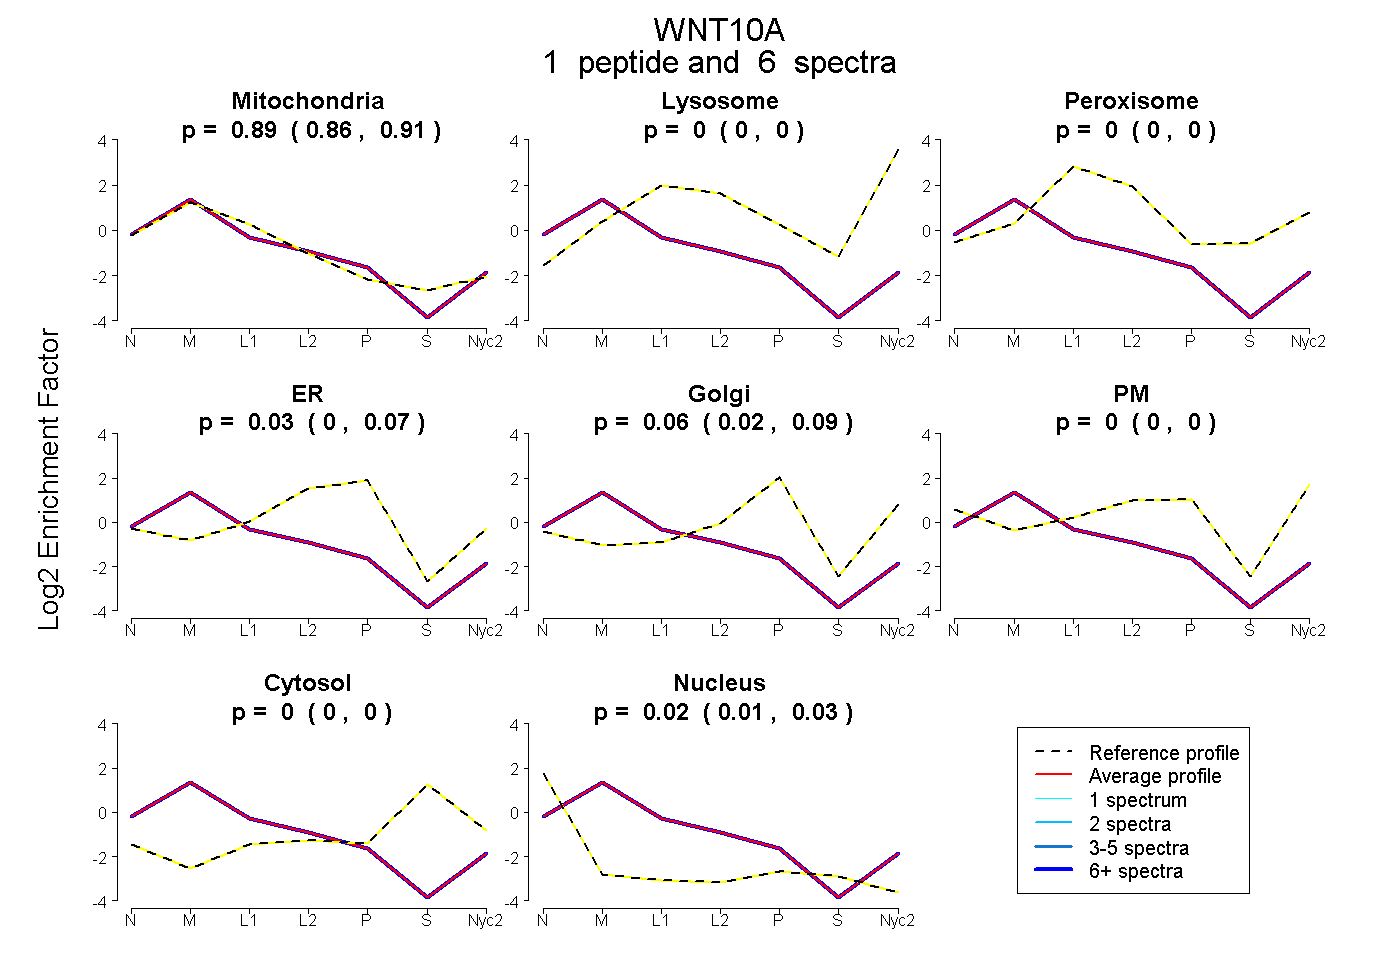
0.865 | 0.905
0.000 | 0.000
0.000 | 0.000
0.000 | 0.069
0.022 | 0.092
0.000 | 0.000
0.000 | 0.000
0.014 | 0.027
1peptide
spectra
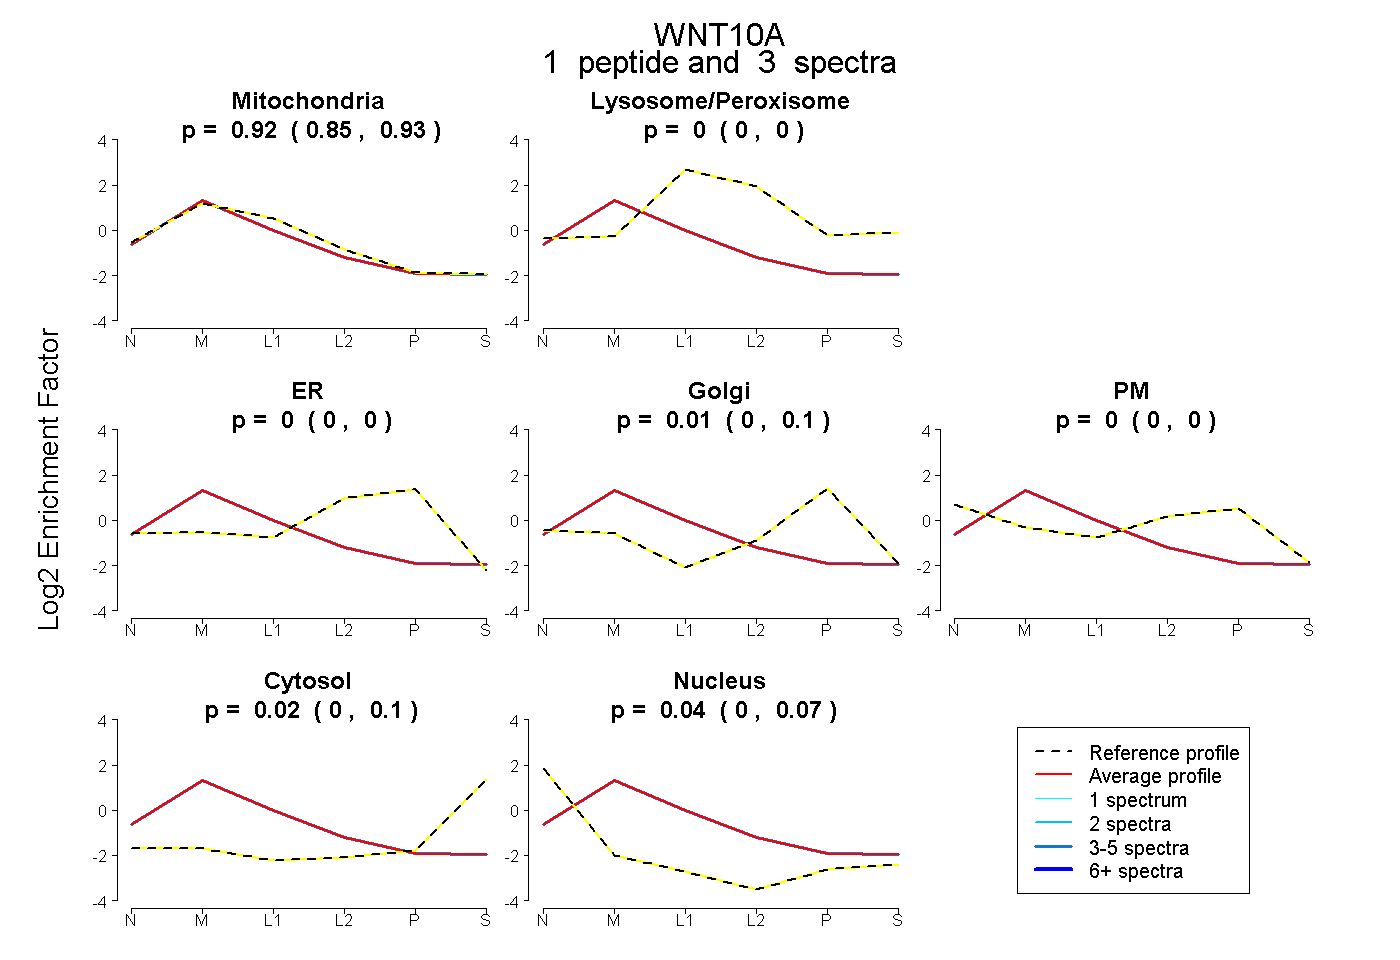
0.853 | 0.931
0.000 | 0.000
0.000 | 0.000
0.000 | 0.099
0.000 | 0.000
0.000 | 0.104
0.000 | 0.073