 1
1peptide
spectra
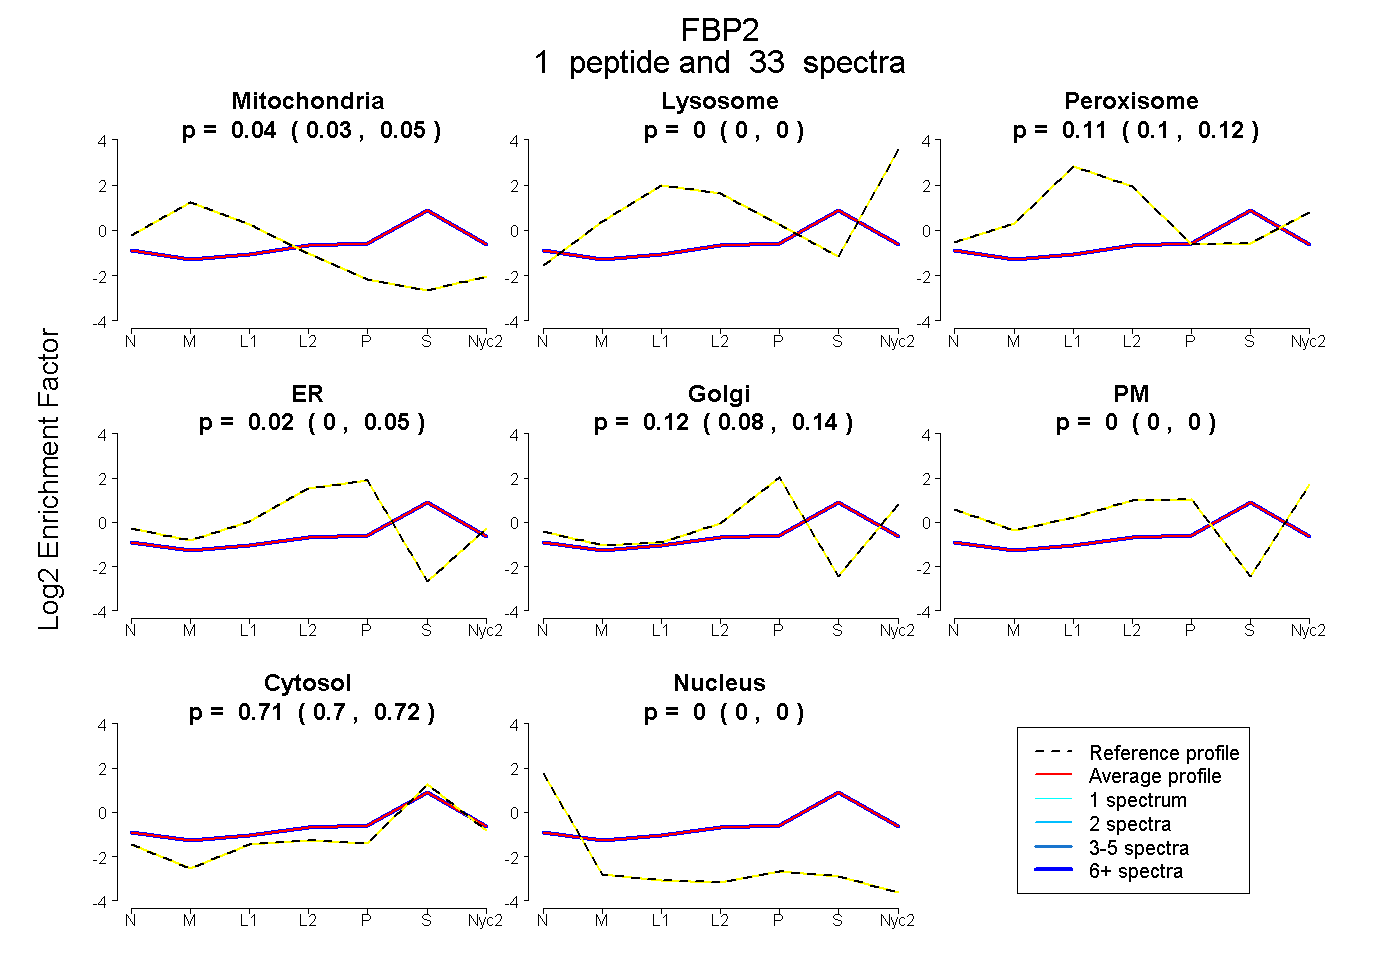
0.033 | 0.052
0.000 | 0.000
0.096 | 0.122
0.000 | 0.048
0.078 | 0.137
0.000 | 0.000
0.704 | 0.720
0.000 | 0.000
1peptide
spectra
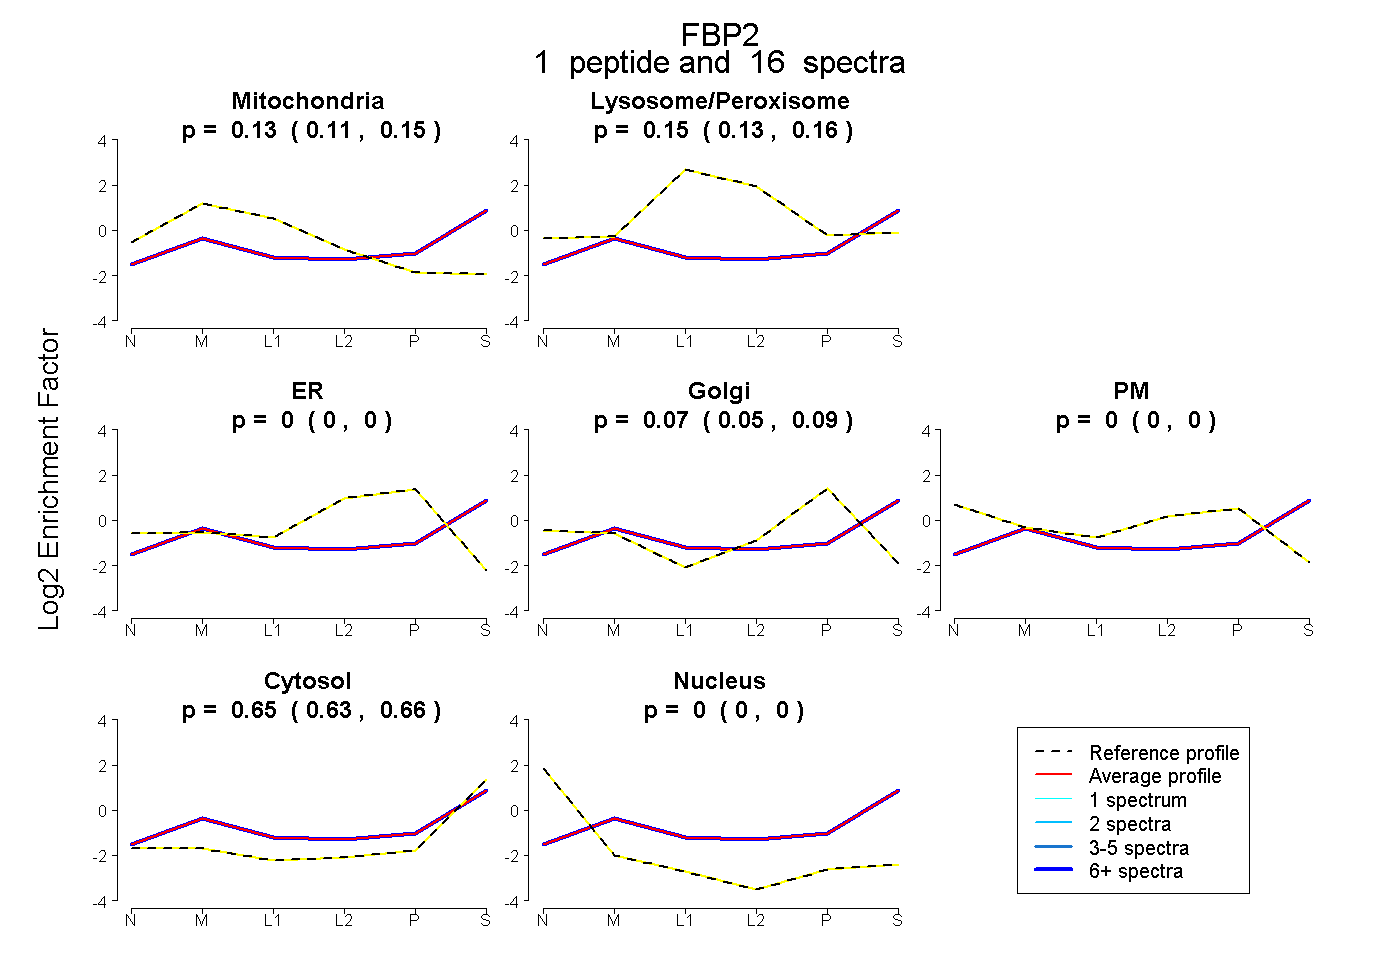
0.106 | 0.152
0.127 | 0.163
0.000 | 0.000
0.047 | 0.090
0.000 | 0.000
0.635 | 0.665
0.000 | 0.000
1peptide
spectra
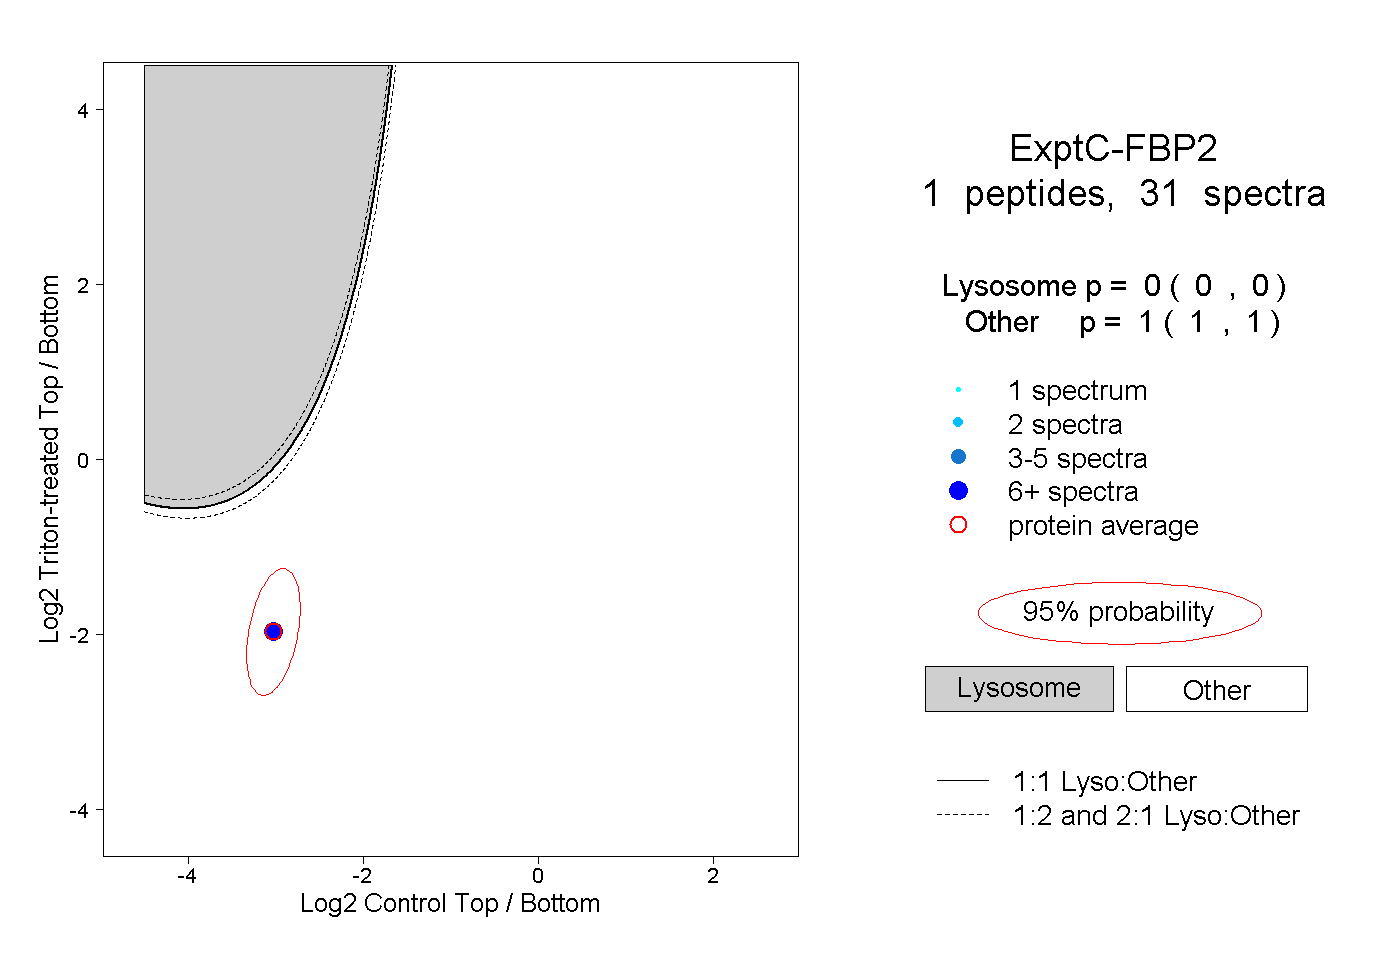
0.000 | 0.000
1.000 | 1.000