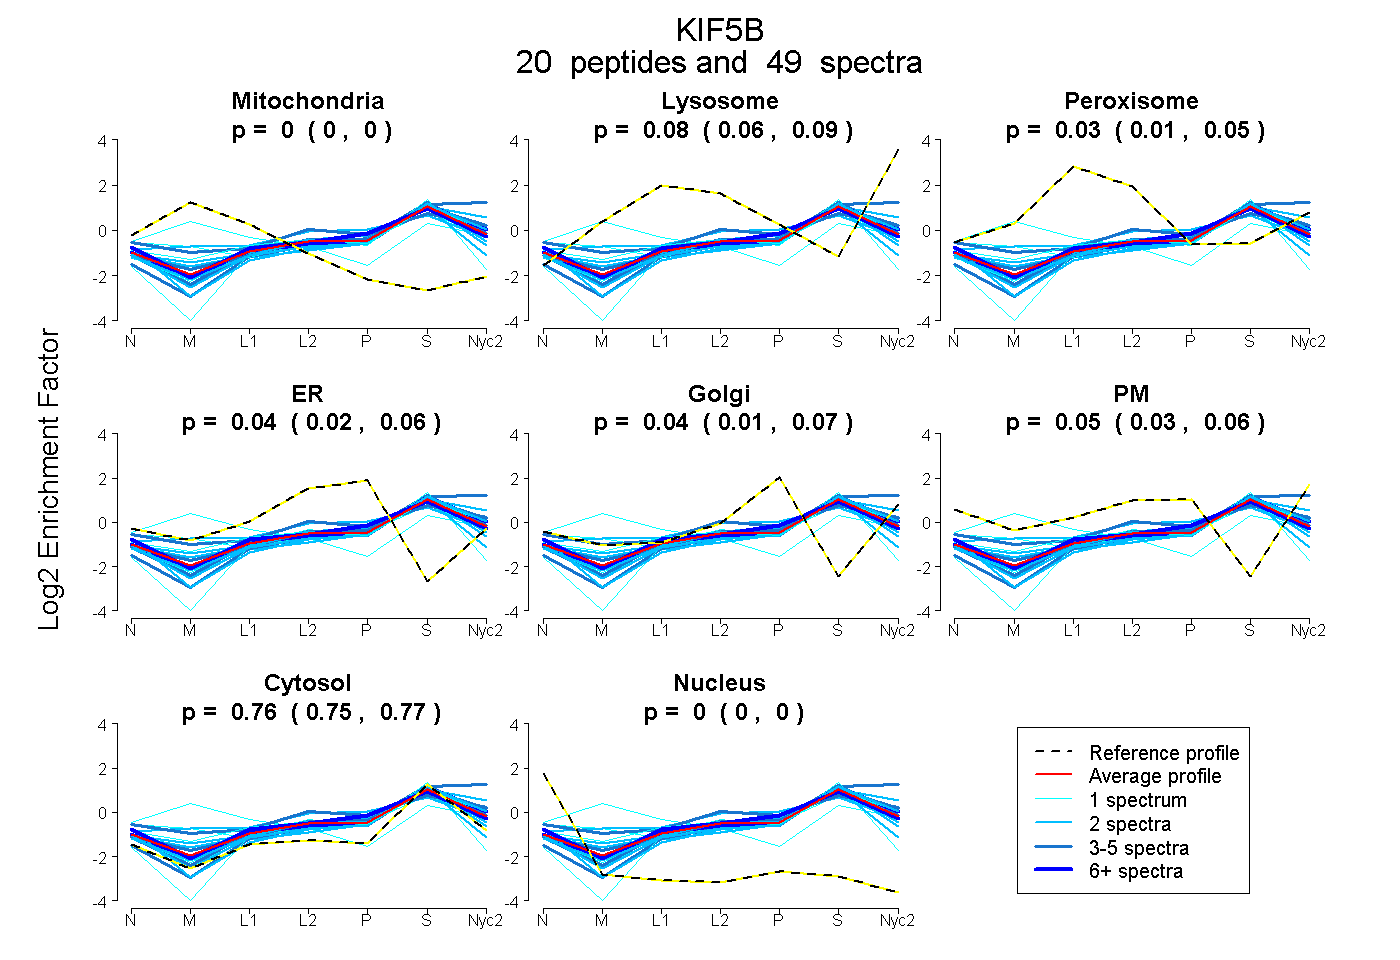
 20
20peptides
spectra
0.000 | 0.000
0.065 | 0.089
0.011 | 0.049
0.019 | 0.058
0.010 | 0.065
0.033 | 0.062
0.751 | 0.769
0.000 | 0.000
| Plot | Mito | Lyso | Perox | ER | Golgi | PM | Cytosol | Nucleus | |||||
| Expt A |
20 peptides |
49 spectra |
|
0.000 0.000 | 0.000 |
0.077 0.065 | 0.089 |
0.032 0.011 | 0.049 |
0.040 0.019 | 0.058 |
0.040 0.010 | 0.065 |
0.049 0.033 | 0.062 |
0.761 0.751 | 0.769 |
0.000 0.000 | 0.000 |
| 2 spectra, STLLFGQR | 0.000 | 0.052 | 0.000 | 0.007 | 0.058 | 0.041 | 0.842 | 0.000 | ||
| 1 spectrum, FVCSPDEVMDTIDEGK | 0.000 | 0.000 | 0.000 | 0.052 | 0.000 | 0.000 | 0.948 | 0.000 | ||
| 3 spectra, DQDNMQAELNR | 0.000 | 0.089 | 0.000 | 0.066 | 0.026 | 0.000 | 0.819 | 0.000 | ||
| 3 spectra, DLLDVSK | 0.000 | 0.276 | 0.000 | 0.000 | 0.000 | 0.000 | 0.724 | 0.000 | ||
| 3 spectra, SQEVEDK | 0.000 | 0.158 | 0.000 | 0.000 | 0.098 | 0.017 | 0.727 | 0.000 | ||
| 2 spectra, MVLEQER | 0.000 | 0.000 | 0.000 | 0.021 | 0.082 | 0.034 | 0.863 | 0.000 | ||
| 1 spectrum, DNADLR | 0.000 | 0.086 | 0.000 | 0.000 | 0.074 | 0.037 | 0.803 | 0.000 | ||
| 1 spectrum, AAEMMASLLK | 0.349 | 0.142 | 0.079 | 0.000 | 0.000 | 0.000 | 0.430 | 0.000 | ||
| 2 spectra, ELQTLHNLR | 0.000 | 0.204 | 0.000 | 0.000 | 0.111 | 0.000 | 0.686 | 0.000 | ||
| 3 spectra, SHSIFLINVK | 0.000 | 0.053 | 0.101 | 0.000 | 0.000 | 0.257 | 0.589 | 0.000 | ||
| 6 spectra, LFVQDLATR | 0.000 | 0.120 | 0.000 | 0.000 | 0.030 | 0.072 | 0.778 | 0.000 | ||
| 2 spectra, ELAACQLR | 0.000 | 0.000 | 0.043 | 0.030 | 0.094 | 0.000 | 0.833 | 0.000 | ||
| 2 spectra, LHDPEGMGIIPR | 0.000 | 0.000 | 0.225 | 0.051 | 0.184 | 0.000 | 0.539 | 0.000 | ||
| 2 spectra, TQMLDQEELLASTR | 0.000 | 0.138 | 0.000 | 0.015 | 0.064 | 0.000 | 0.783 | 0.000 | ||
| 8 spectra, VQTANEVK | 0.000 | 0.000 | 0.105 | 0.022 | 0.163 | 0.009 | 0.701 | 0.000 | ||
| 3 spectra, EMTNHQK | 0.000 | 0.060 | 0.000 | 0.000 | 0.095 | 0.000 | 0.845 | 0.000 | ||
| 2 spectra, ILQDSLGGNCR | 0.012 | 0.000 | 0.062 | 0.174 | 0.000 | 0.000 | 0.752 | 0.000 | ||
| 1 spectrum, EYELLSDELNQK | 0.000 | 0.079 | 0.014 | 0.033 | 0.049 | 0.000 | 0.825 | 0.000 | ||
| 1 spectrum, TGAEGAVLDEAK | 0.000 | 0.095 | 0.106 | 0.000 | 0.000 | 0.102 | 0.696 | 0.000 | ||
| 1 spectrum, GLEETVAK | 0.062 | 0.000 | 0.048 | 0.000 | 0.000 | 0.240 | 0.649 | 0.000 |
| Plot | Mito | Lyso or Perox | ER | Golgi | PM | Cytosol | Nucleus | ||||||
| Expt B |
8 peptides |
8 spectra |
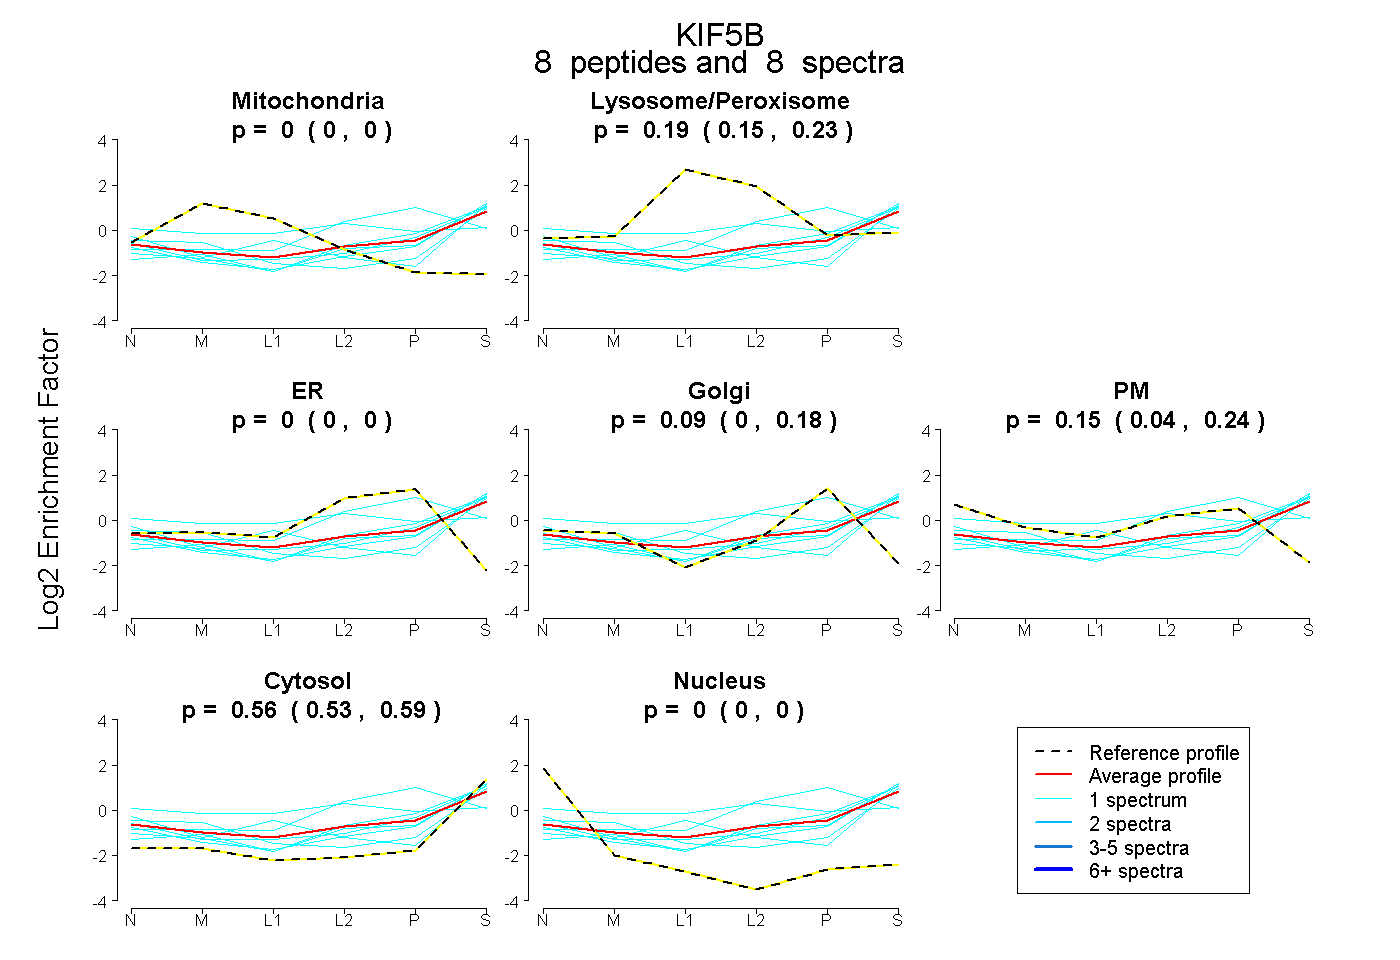 |
0.000 0.000 | 0.000 |
0.194 0.152 | 0.232 |
0.000 0.000 | 0.000 |
0.091 0.000 | 0.184 |
0.152 0.035 | 0.235 |
0.563 0.527 | 0.595 |
0.000 0.000 | 0.000 |
|||
| Plot | Lyso | Other | |||||||||||
| Expt C |
28 peptides |
62 spectra |
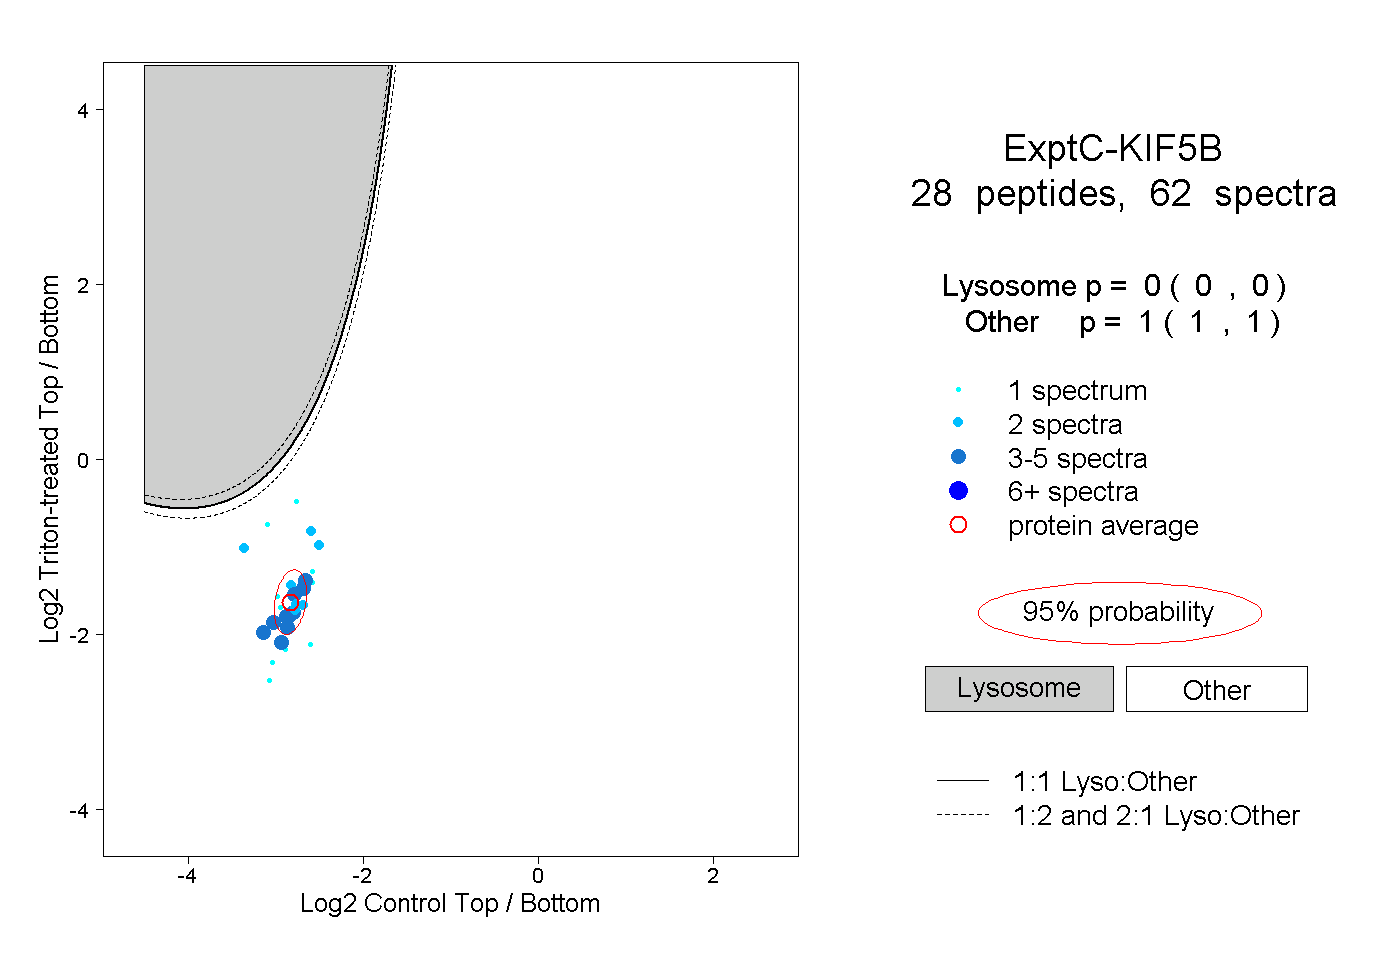 |
0.000 0.000 | 0.000 |
1.000 1.000 | 1.000 |
||||||||
| Plot | Lyso | Other | |||||||||||
| Expt D |
3 peptides |
4 spectra |
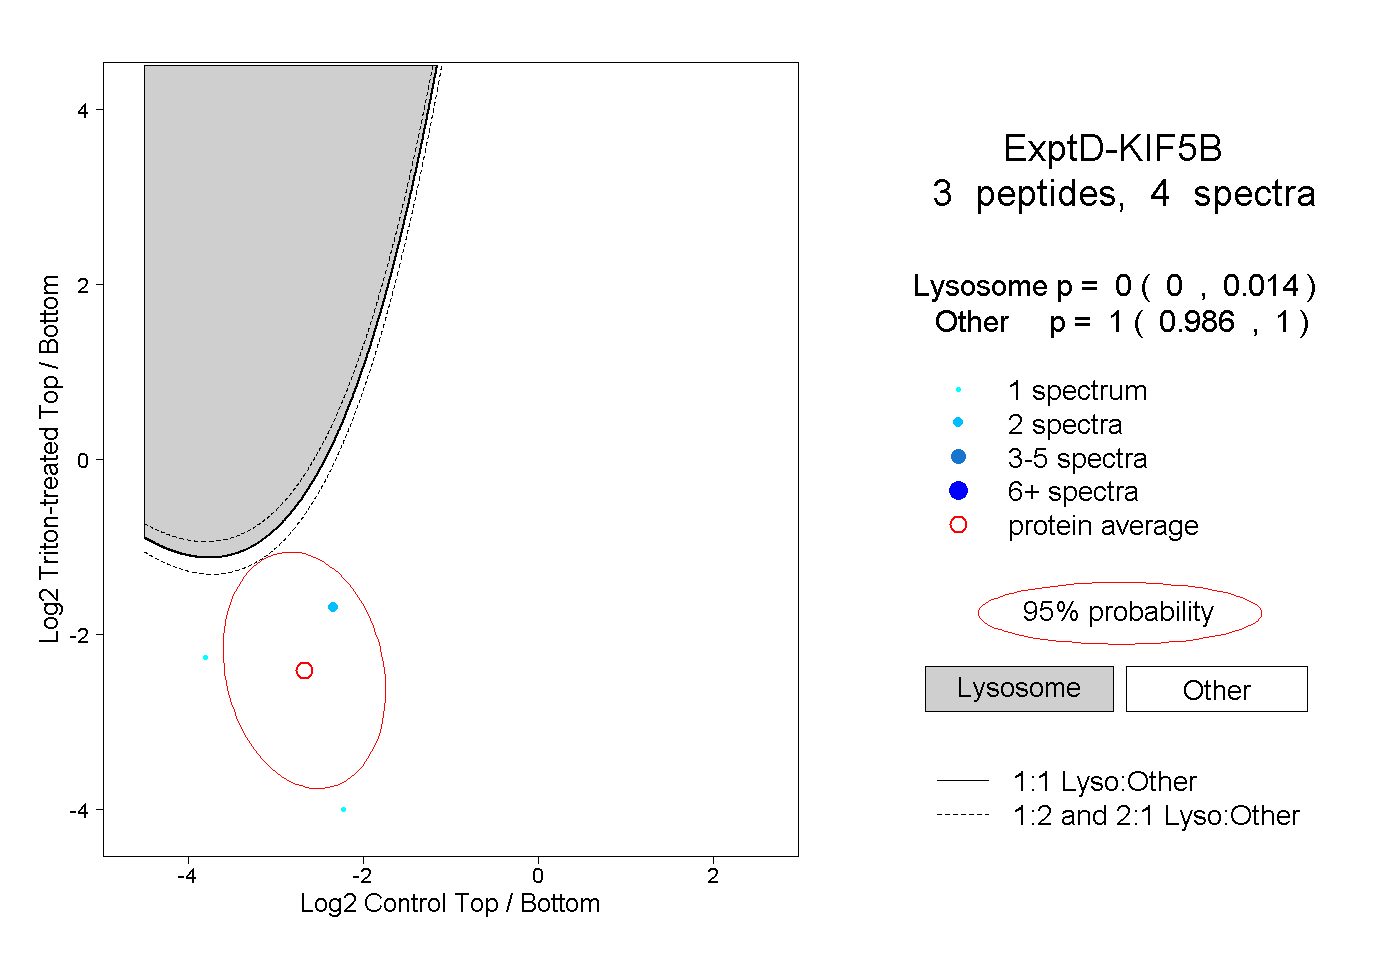 |
0.000 0.000 | 0.014 |
1.000 0.986 | 1.000 |