 8
8peptides
spectra
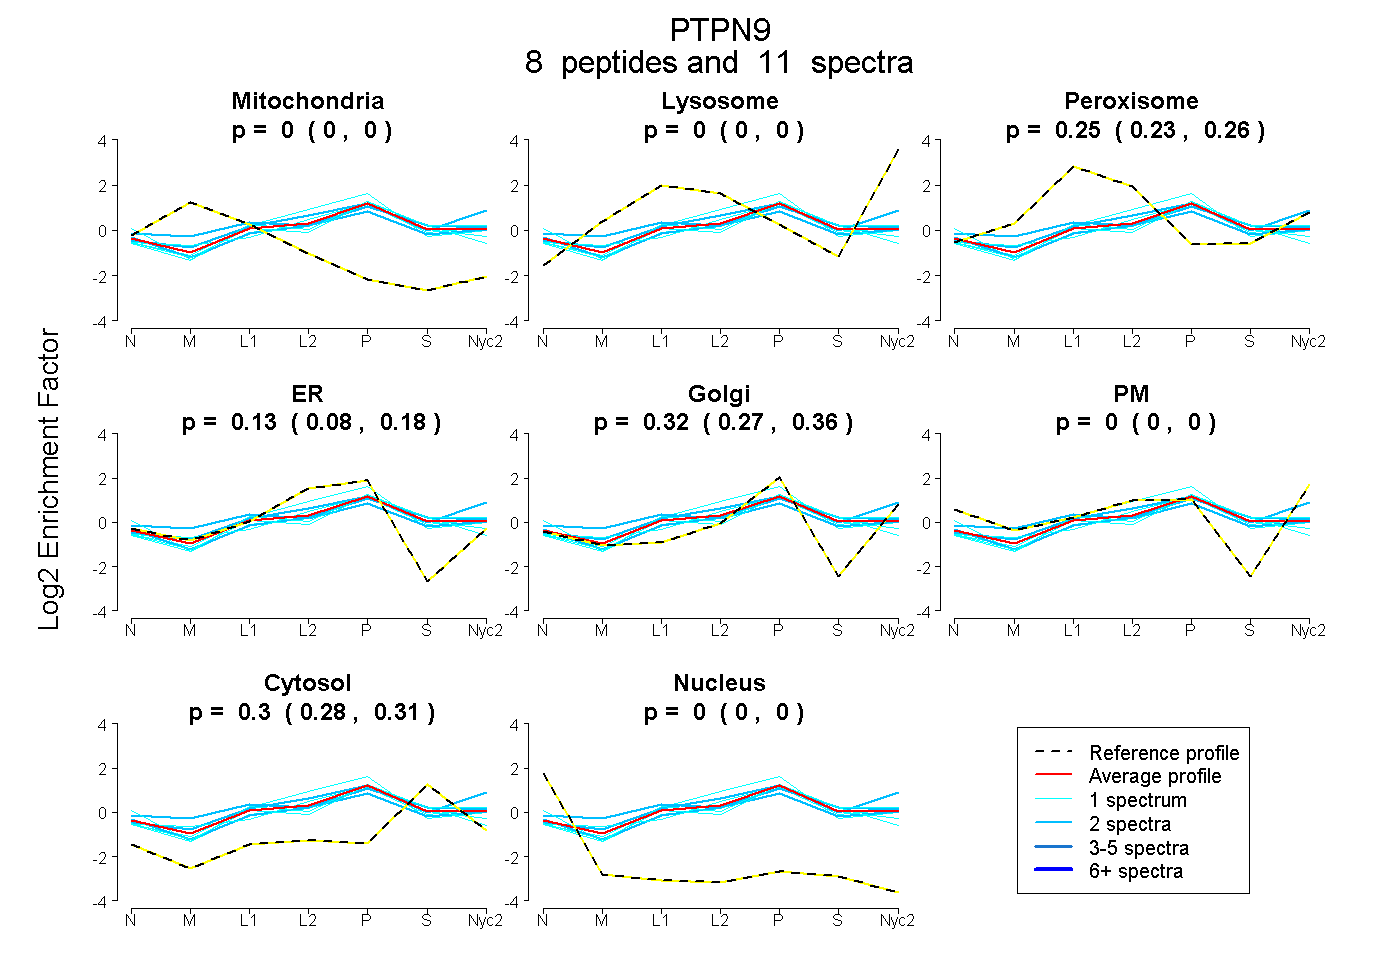
0.000 | 0.000
0.000 | 0.000
0.231 | 0.264
0.083 | 0.177
0.271 | 0.358
0.000 | 0.000
0.284 | 0.309
0.000 | 0.000
7peptides
spectra
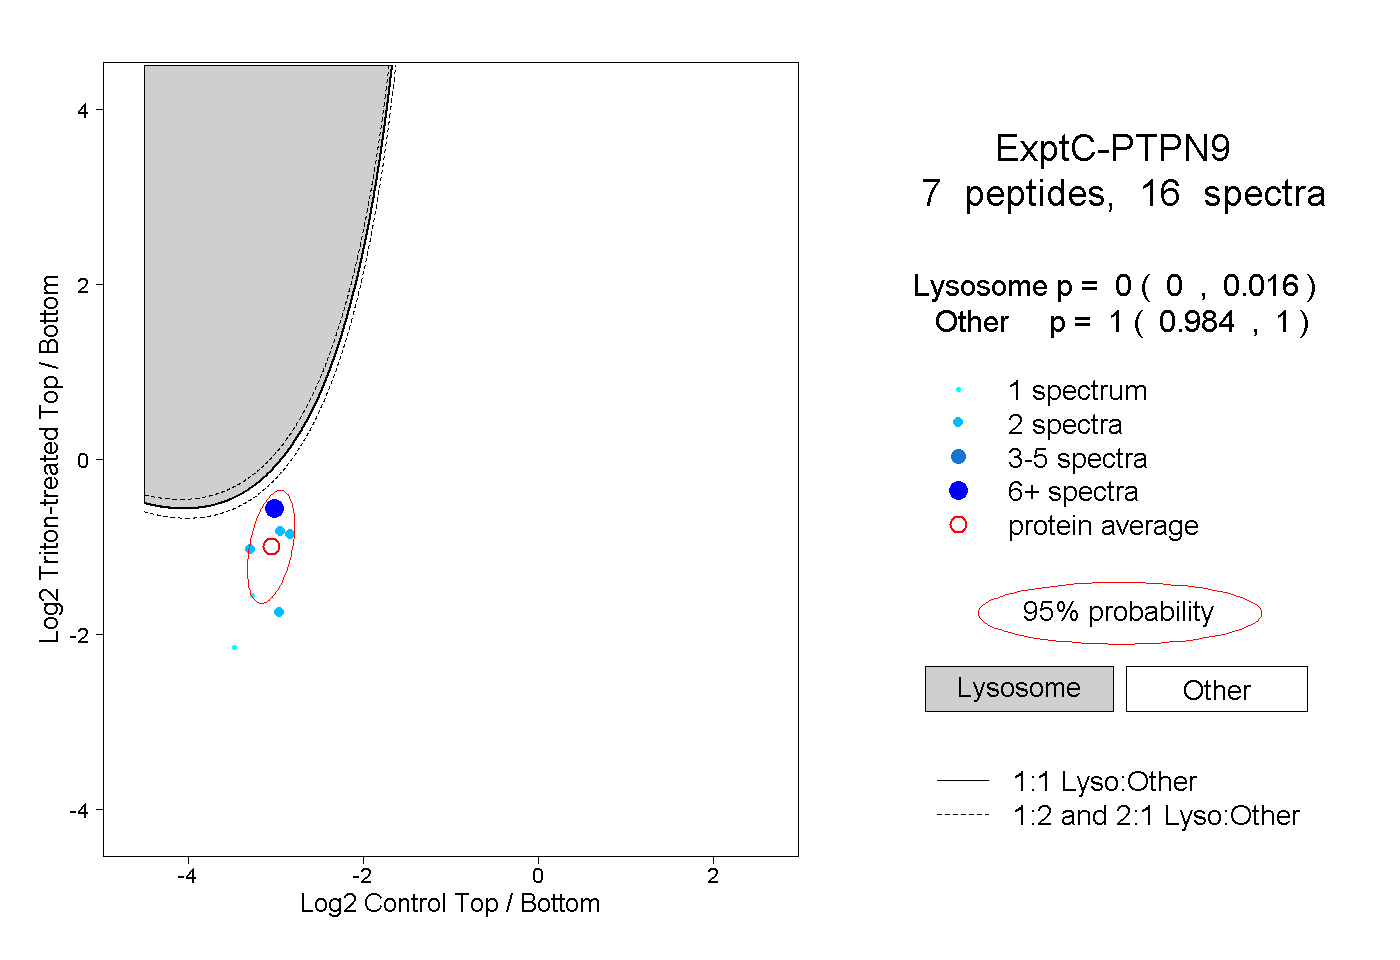
0.000 | 0.016
0.984 | 1.000
1peptide
spectrum
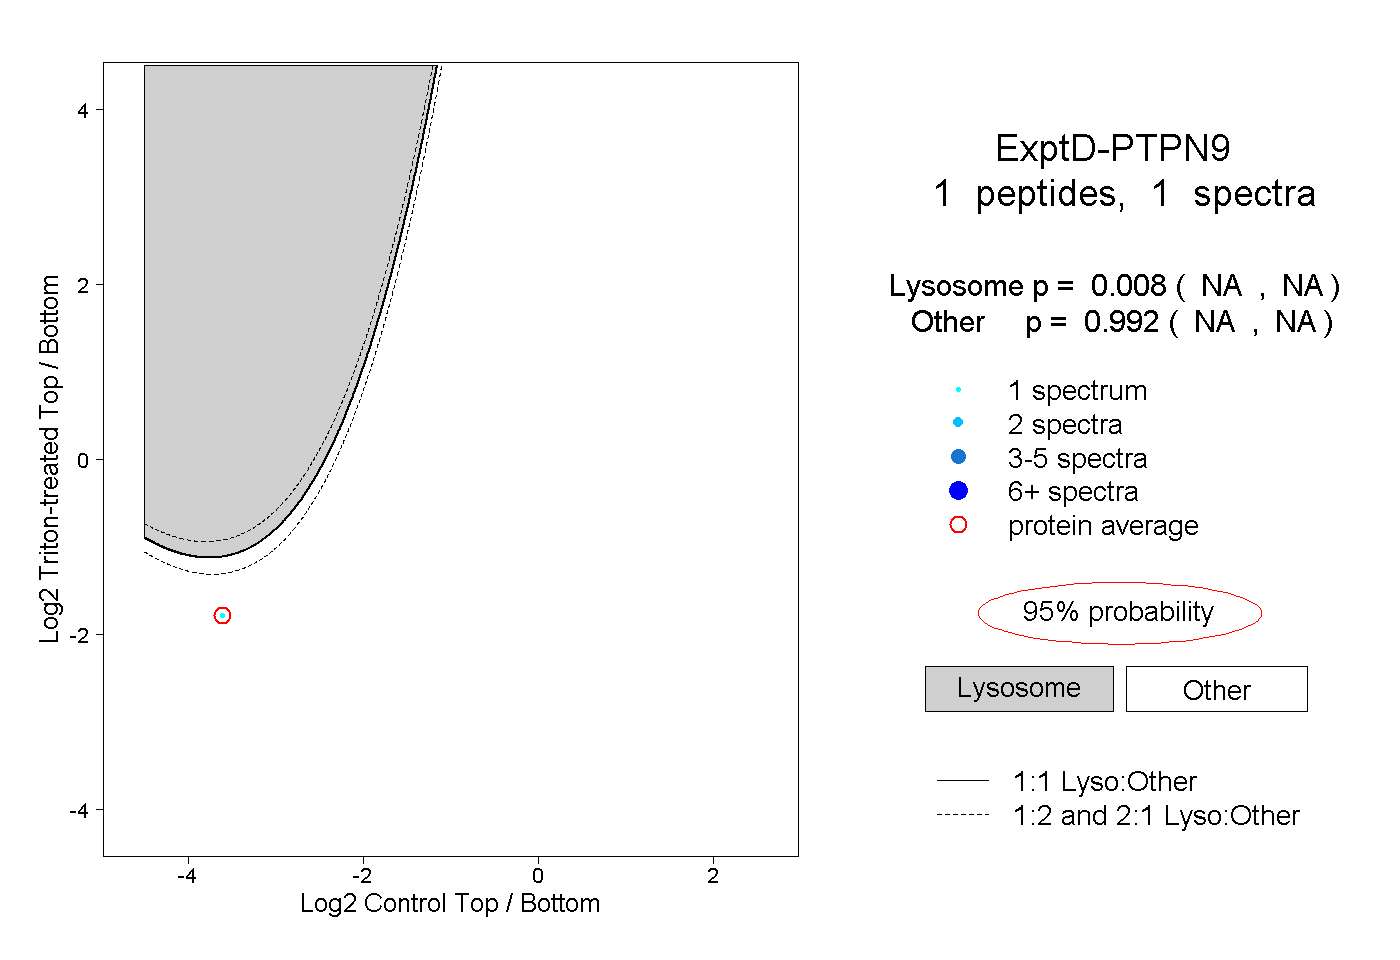
NA | NA
NA | NA