6
6peptides
spectra
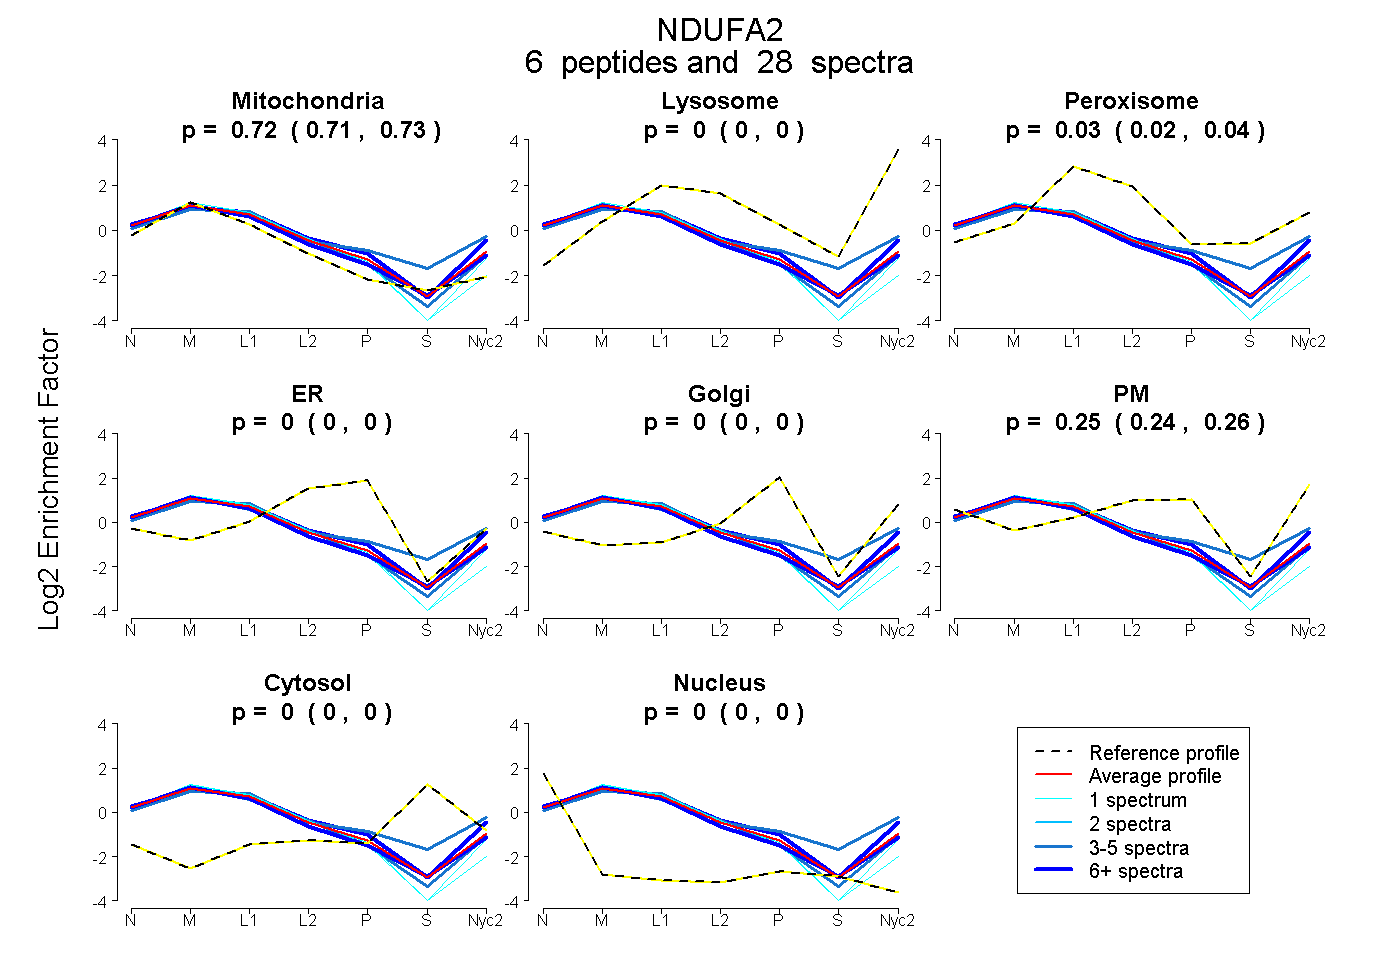
0.706 | 0.727
0.000 | 0.000
0.021 | 0.042
0.000 | 0.000
0.000 | 0.000
0.236 | 0.261
0.000 | 0.000
0.000 | 0.000
4peptides
spectra
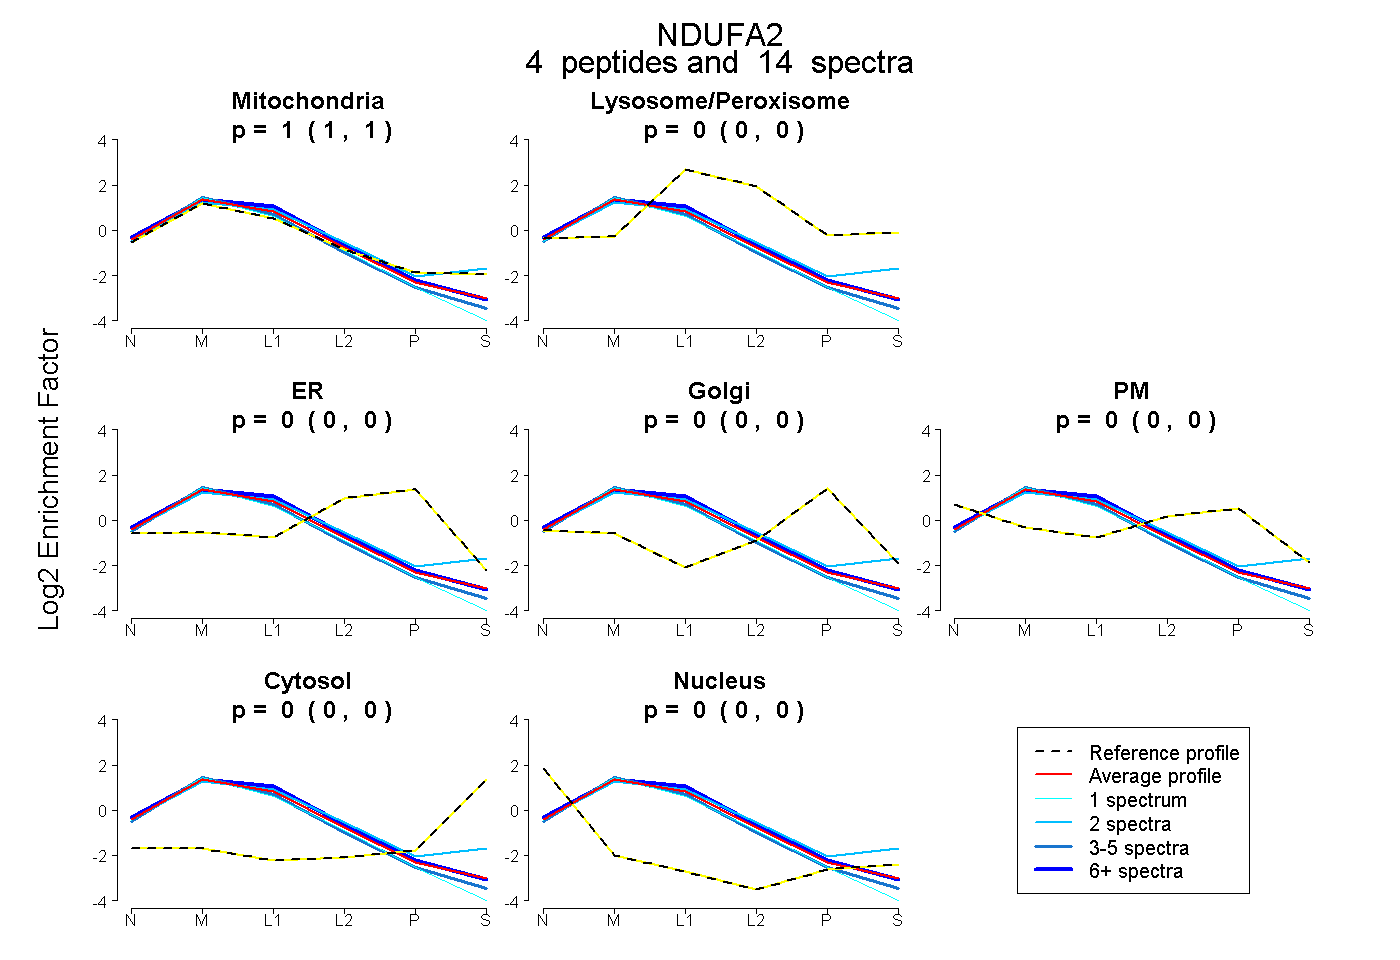
1.000 | 1.000
0.000 | 0.000
0.000 | 0.000
0.000 | 0.000
0.000 | 0.000
0.000 | 0.000
0.000 | 0.000