 6
6peptides
spectra
0.706 | 0.727
0.000 | 0.000
0.021 | 0.042
0.000 | 0.000
0.000 | 0.000
0.236 | 0.261
0.000 | 0.000
0.000 | 0.000
| Plot | Mito | Lyso | Perox | ER | Golgi | PM | Cytosol | Nucleus | |||||
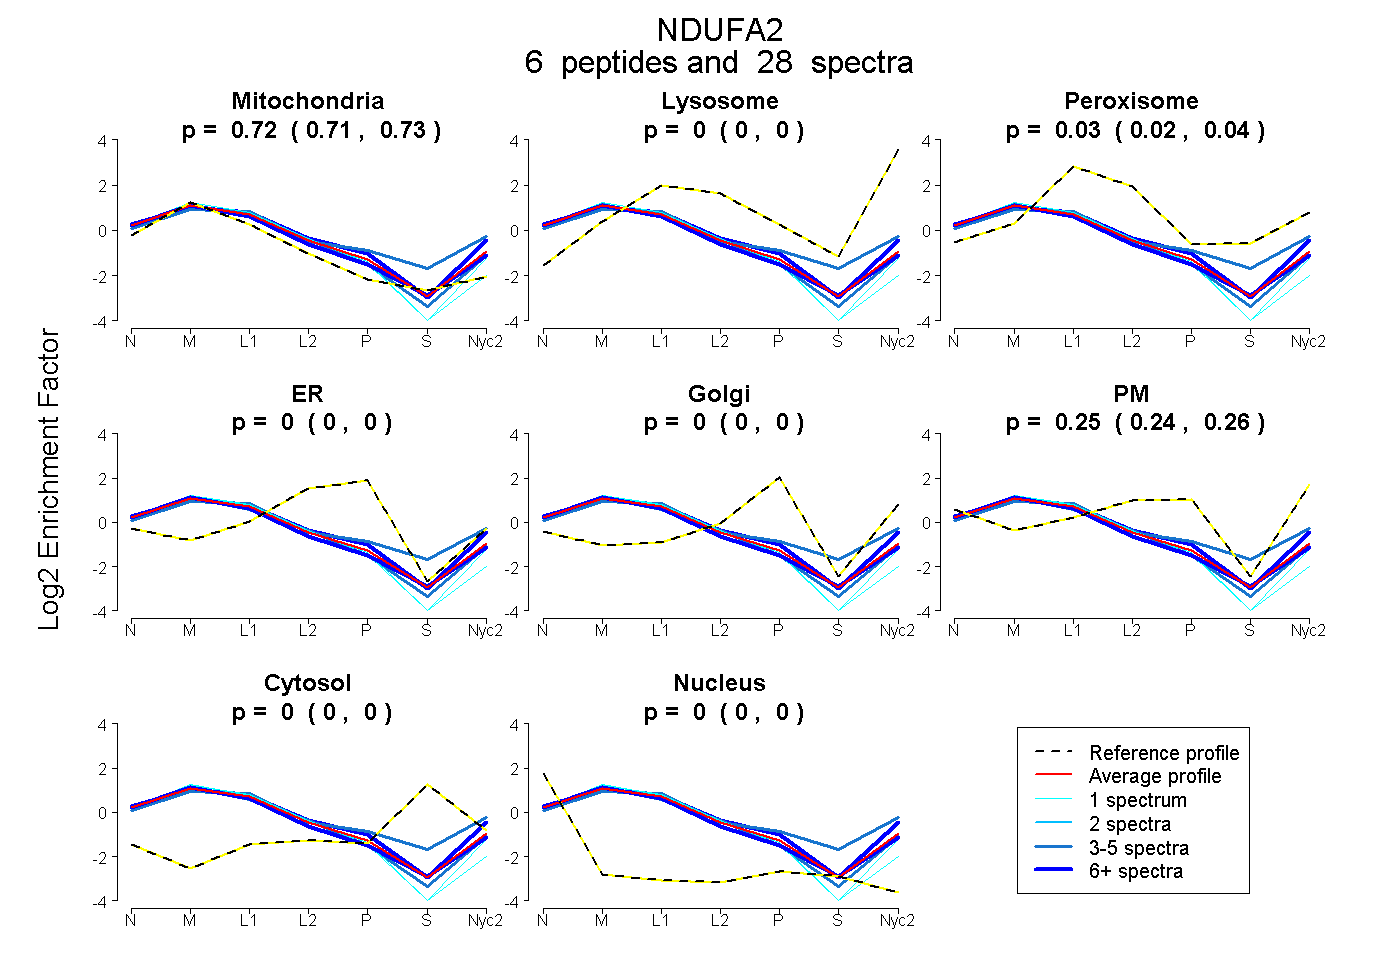
| Expt A |
6 peptides |
28 spectra |
|
0.717 0.706 | 0.727 |
0.000 0.000 | 0.000 |
0.033 0.021 | 0.042 |
0.000 0.000 | 0.000 |
0.000 0.000 | 0.000 |
0.250 0.236 | 0.261 |
0.000 0.000 | 0.000 |
0.000 0.000 | 0.000 |
| 9 spectra, AHPDLPILIR | 0.636 | 0.043 | 0.000 | 0.000 | 0.000 | 0.321 | 0.000 | 0.000 | ||
| 10 spectra, SPGSQGVR | 0.777 | 0.000 | 0.014 | 0.000 | 0.000 | 0.208 | 0.000 | 0.000 | ||
| 1 spectrum, NVSLNNLSAAEVTK | 0.786 | 0.000 | 0.000 | 0.000 | 0.000 | 0.214 | 0.000 | 0.000 | ||
| 4 spectra, DFIQQR | 0.768 | 0.000 | 0.000 | 0.000 | 0.000 | 0.232 | 0.000 | 0.000 | ||
| 3 spectra, AMENVLSGK | 0.544 | 0.088 | 0.141 | 0.000 | 0.000 | 0.195 | 0.033 | 0.000 | ||
| 1 spectrum, IHLCQR | 0.842 | 0.000 | 0.000 | 0.158 | 0.000 | 0.000 | 0.000 | 0.000 |
| Plot | Mito | Lyso or Perox | ER | Golgi | PM | Cytosol | Nucleus | ||||||
| Expt B |
4 peptides |
14 spectra |
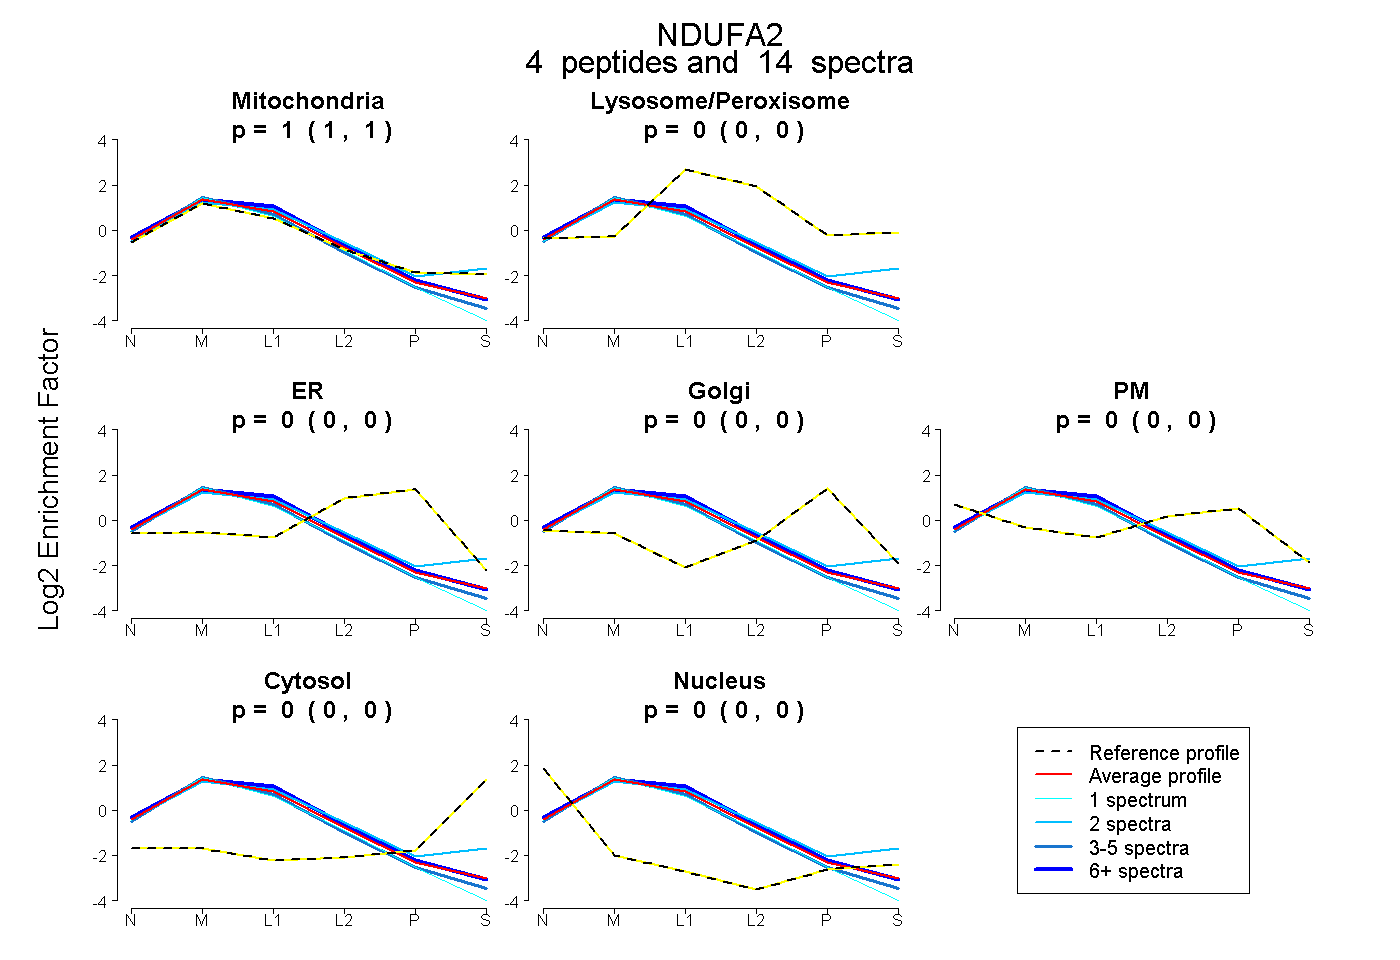 |
1.000 1.000 | 1.000 |
0.000 0.000 | 0.000 |
0.000 0.000 | 0.000 |
0.000 0.000 | 0.000 |
0.000 0.000 | 0.000 |
0.000 0.000 | 0.000 |
0.000 0.000 | 0.000 |
|||
| Plot | Lyso | Other | |||||||||||
| Expt C |
9 peptides |
117 spectra |
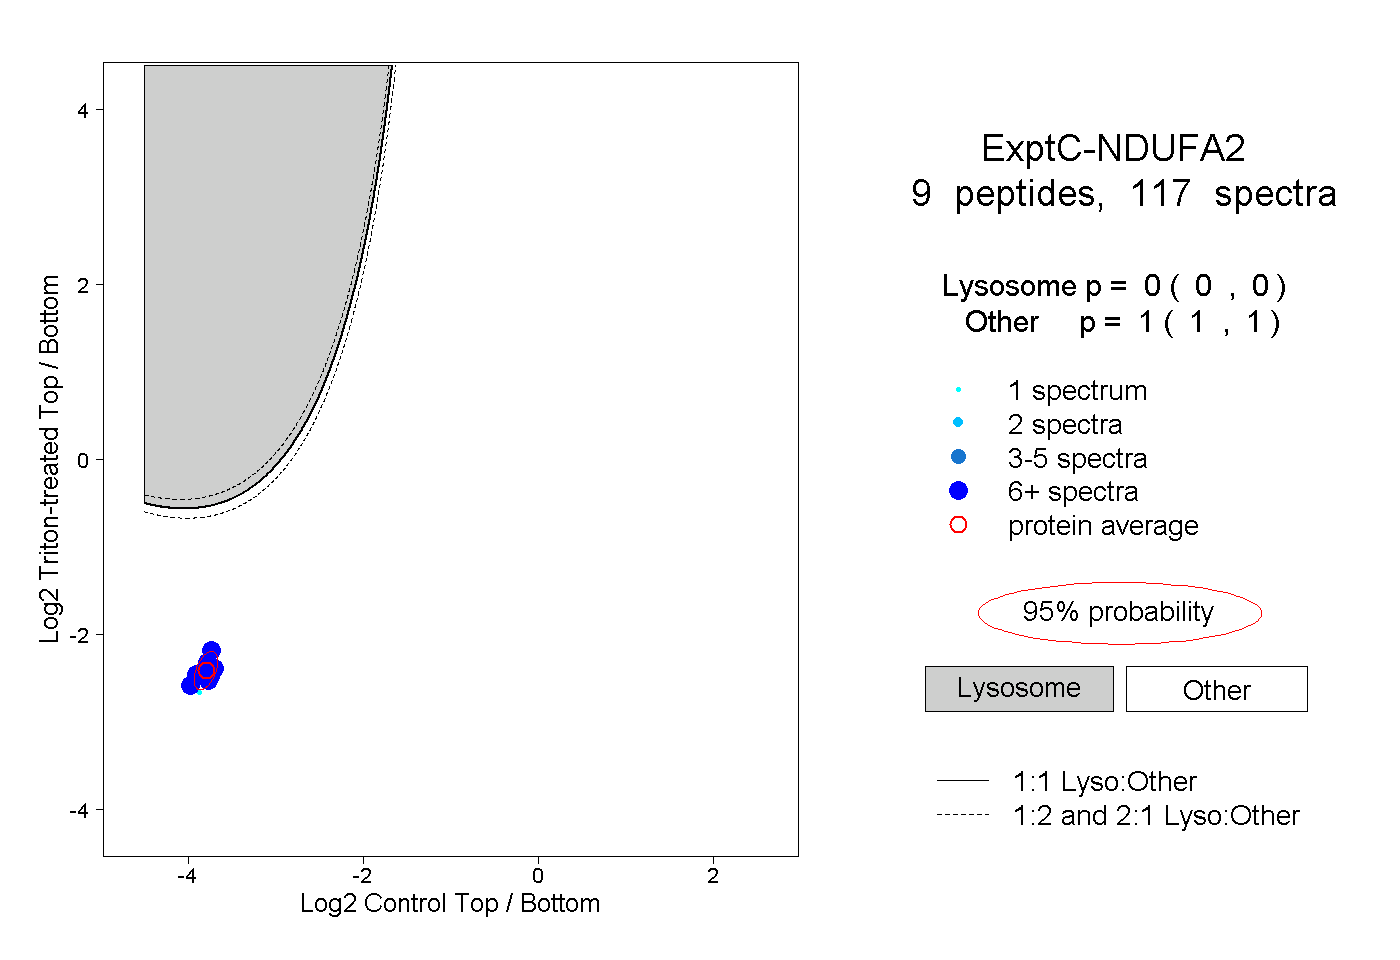 |
0.000 0.000 | 0.000 |
1.000 1.000 | 1.000 |
||||||||
| Plot | Lyso | Other | |||||||||||
| Expt D |
3 peptides |
6 spectra |
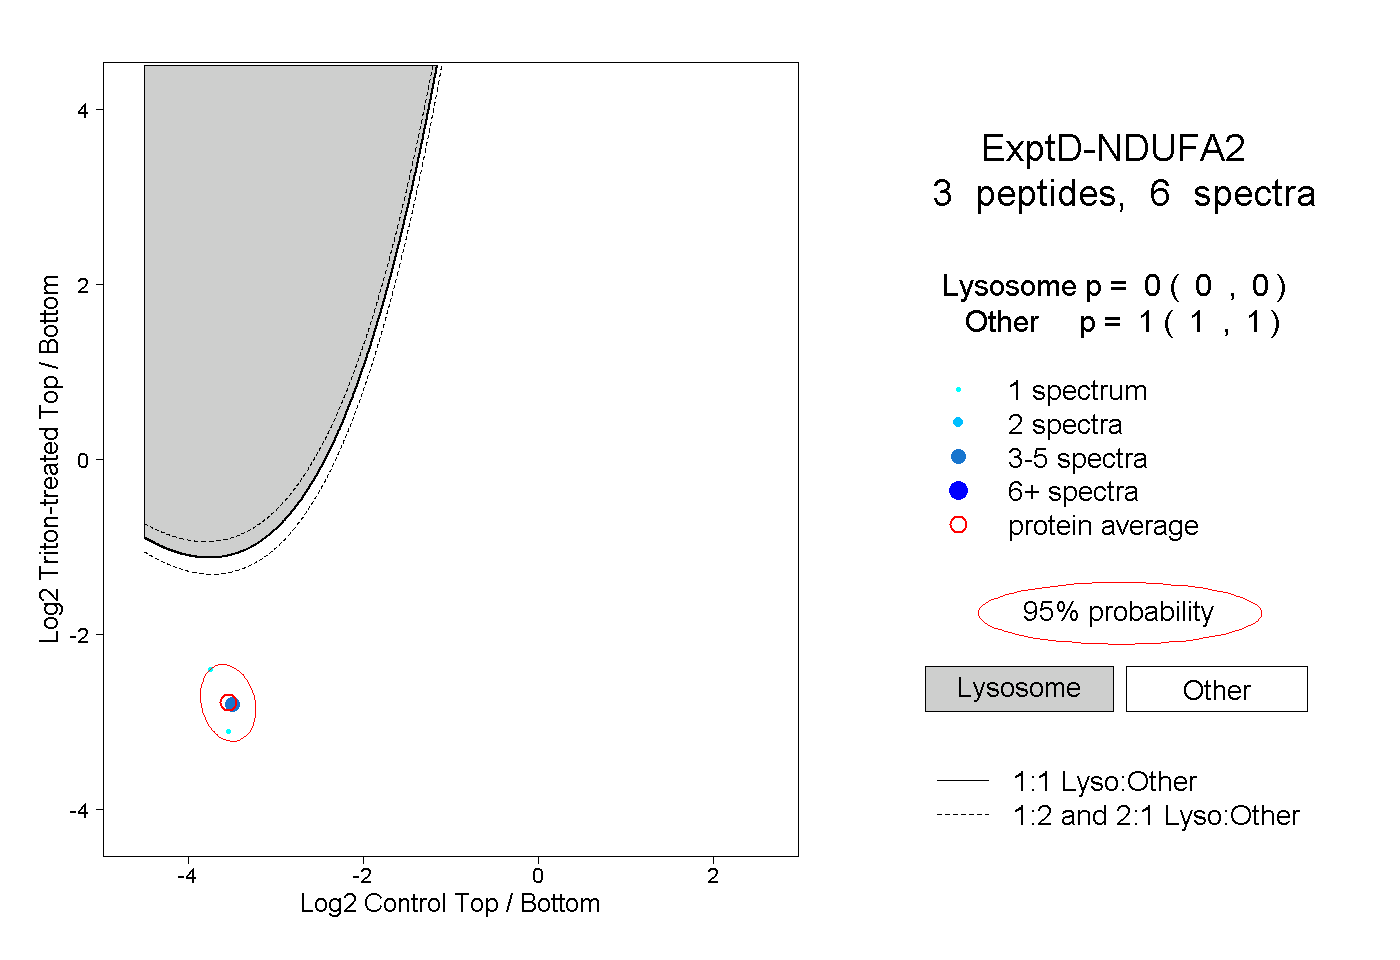 |
0.000 0.000 | 0.000 |
1.000 1.000 | 1.000 |