 4
4peptides
spectra
0.000 | 0.000
0.324 | 0.443
0.000 | 0.000
0.000 | 0.000
0.000 | 0.000
0.548 | 0.664
0.000 | 0.000
0.000 | 0.000
10peptides
spectra
0.000 | 0.306
0.690 | 1.000
| Plot | Mito | Lyso | Perox | ER | Golgi | PM | Cytosol | Nucleus | |||||
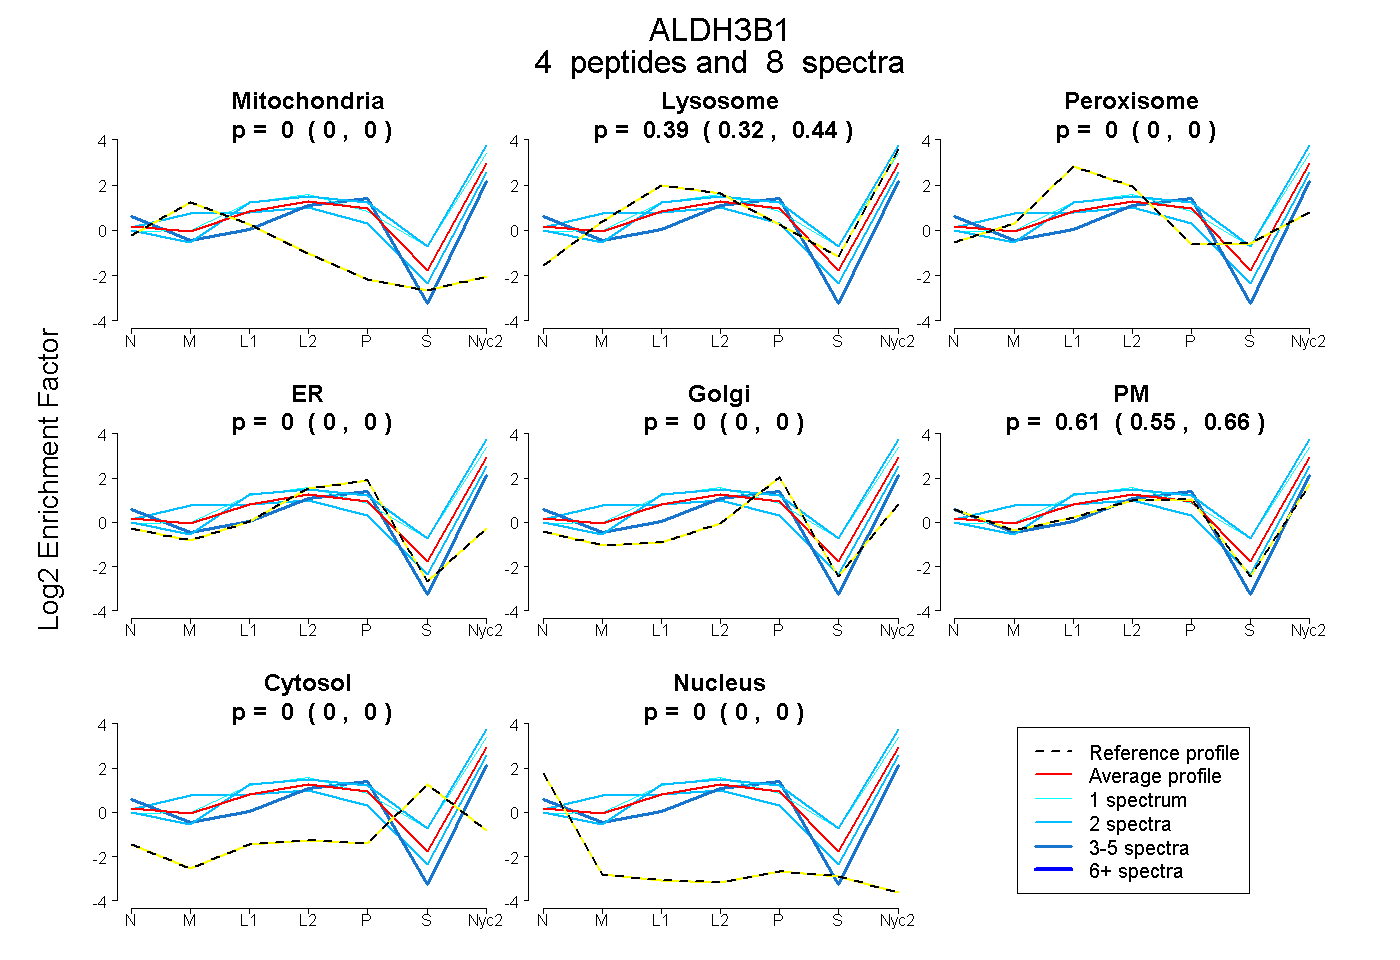
| Expt A |
4 peptides |
8 spectra |
|
0.000 0.000 | 0.000 |
0.391 0.324 | 0.443 |
0.000 0.000 | 0.000 |
0.000 0.000 | 0.000 |
0.000 0.000 | 0.000 |
0.609 0.548 | 0.664 |
0.000 0.000 | 0.000 |
0.000 0.000 | 0.000 |
||
| Plot | Lyso | Other | |||||||||||
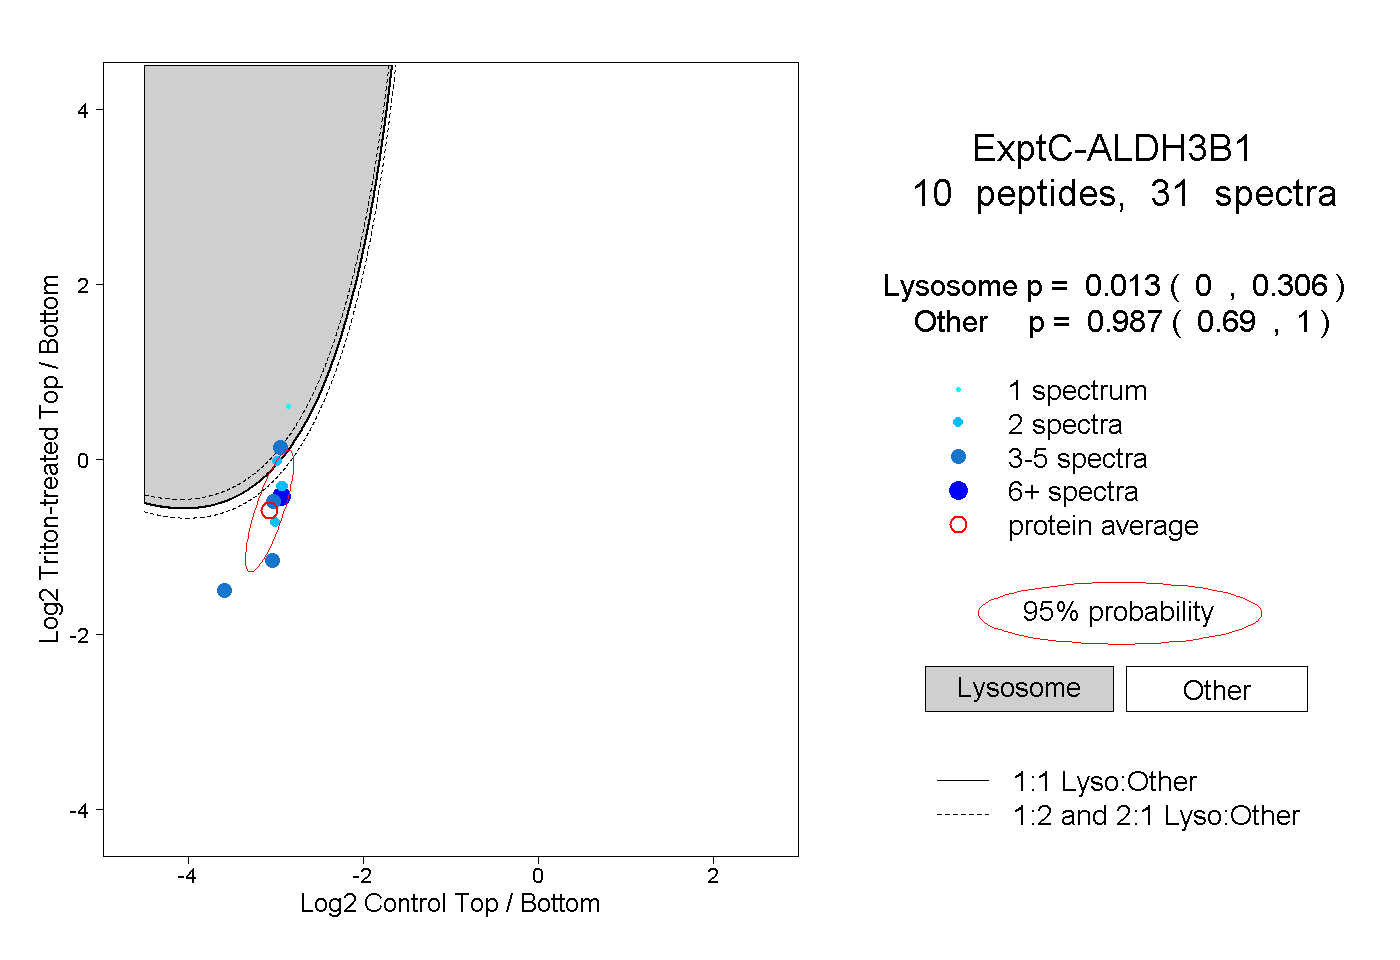
| Expt C |
10 peptides |
31 spectra |
|
0.013 0.000 | 0.306 |
0.987 0.690 | 1.000 |
| 4 spectra, LQGLLGCGR | 0.026 | 0.974 | ||||||||
| 2 spectra, VAIGGQSDEGER | 0.570 | 0.430 | ||||||||
| 4 spectra, QQLQEALAQDLHK | 0.000 | 1.000 | ||||||||
| 5 spectra, AAQLQGLSHFLR | 0.000 | 1.000 | ||||||||
| 3 spectra, ILAEVLPR | 0.794 | 0.206 | ||||||||
| 1 spectrum, FYGDNPQTSPNLGR | 0.988 | 0.012 | ||||||||
| 6 spectra, IVMAAAAK | 0.019 | 0.981 | ||||||||
| 2 spectra, FSFDTFSNQR | 0.002 | 0.998 | ||||||||
| 2 spectra, LVPALQNAITR | 0.051 | 0.949 | ||||||||
| 2 spectra, NLATQLDSAFIR | 0.042 | 0.958 |
| Plot | Lyso | Other | |||||||||||
| Expt D |
2 peptides |
3 spectra |
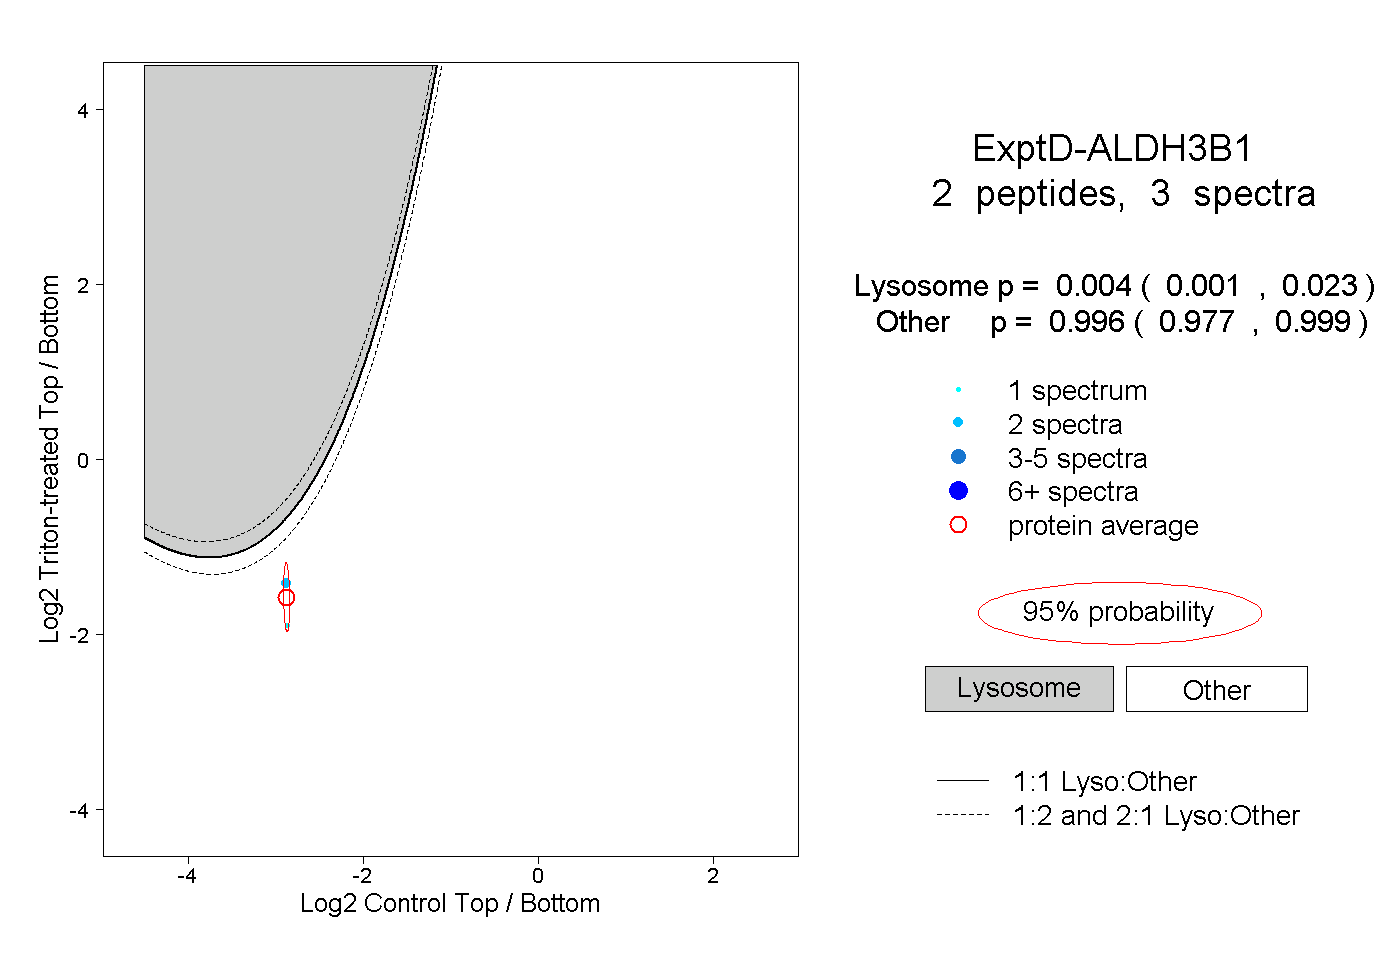 |
0.004 0.001 | 0.023 |
0.996 0.977 | 0.999 |