 4
4peptides
spectra
0.000 | 0.000
0.324 | 0.443
0.000 | 0.000
0.000 | 0.000
0.000 | 0.000
0.548 | 0.664
0.000 | 0.000
0.000 | 0.000
| Plot | Mito | Lyso | Perox | ER | Golgi | PM | Cytosol | Nucleus | |||||
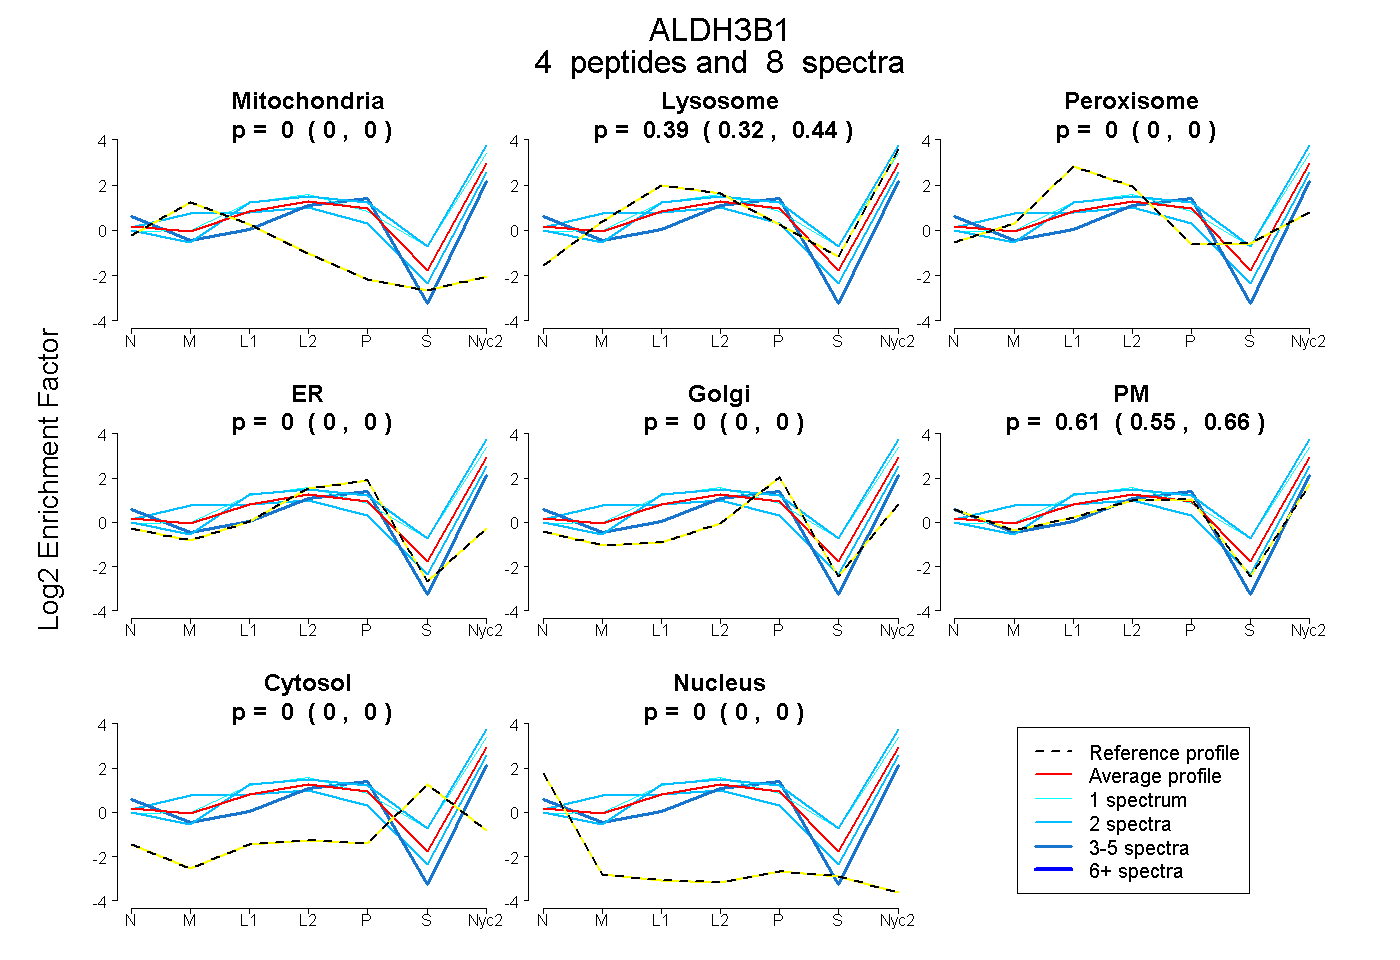
| Expt A |
4 peptides |
8 spectra |
|
0.000 0.000 | 0.000 |
0.391 0.324 | 0.443 |
0.000 0.000 | 0.000 |
0.000 0.000 | 0.000 |
0.000 0.000 | 0.000 |
0.609 0.548 | 0.664 |
0.000 0.000 | 0.000 |
0.000 0.000 | 0.000 |
| 3 spectra, ILAEVLPR | 0.000 | 0.000 | 0.000 | 0.000 | 0.003 | 0.997 | 0.000 | 0.000 | ||
| 2 spectra, VAIGGQSDEGER | 0.000 | 0.635 | 0.000 | 0.000 | 0.000 | 0.365 | 0.000 | 0.000 | ||
| 1 spectrum, QQLQEALAQDLHK | 0.000 | 0.649 | 0.000 | 0.000 | 0.000 | 0.351 | 0.000 | 0.000 | ||
| 2 spectra, AAQLQGLSHFLR | 0.079 | 0.370 | 0.000 | 0.000 | 0.000 | 0.552 | 0.000 | 0.000 |
| Plot | Lyso | Other | |||||||||||
| Expt C |
10 peptides |
31 spectra |
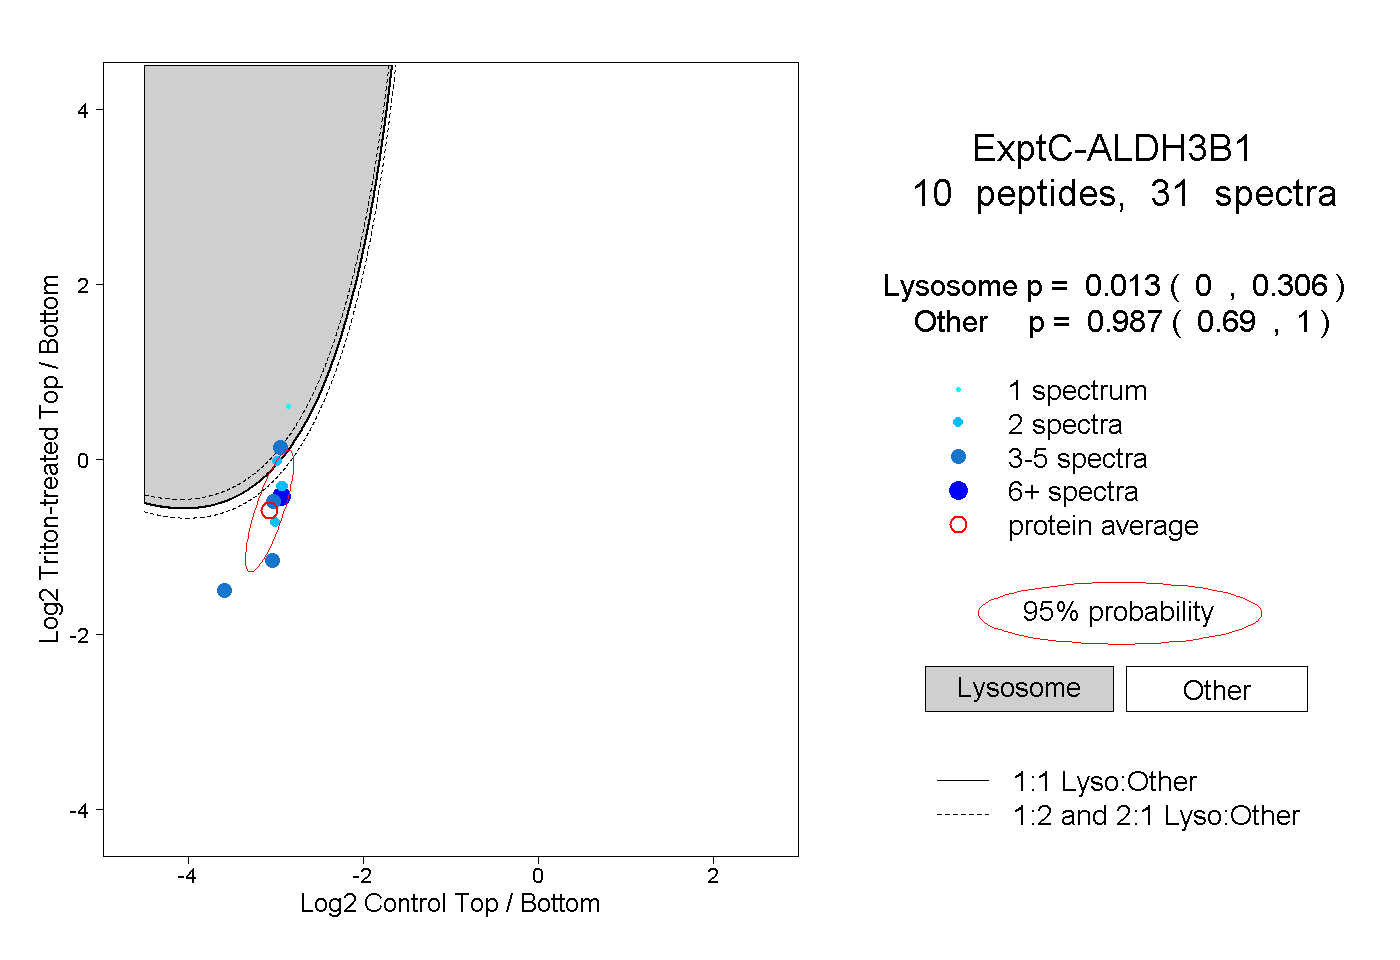 |
0.013 0.000 | 0.306 |
0.987 0.690 | 1.000 |
||||||||
| Plot | Lyso | Other | |||||||||||
| Expt D |
2 peptides |
3 spectra |
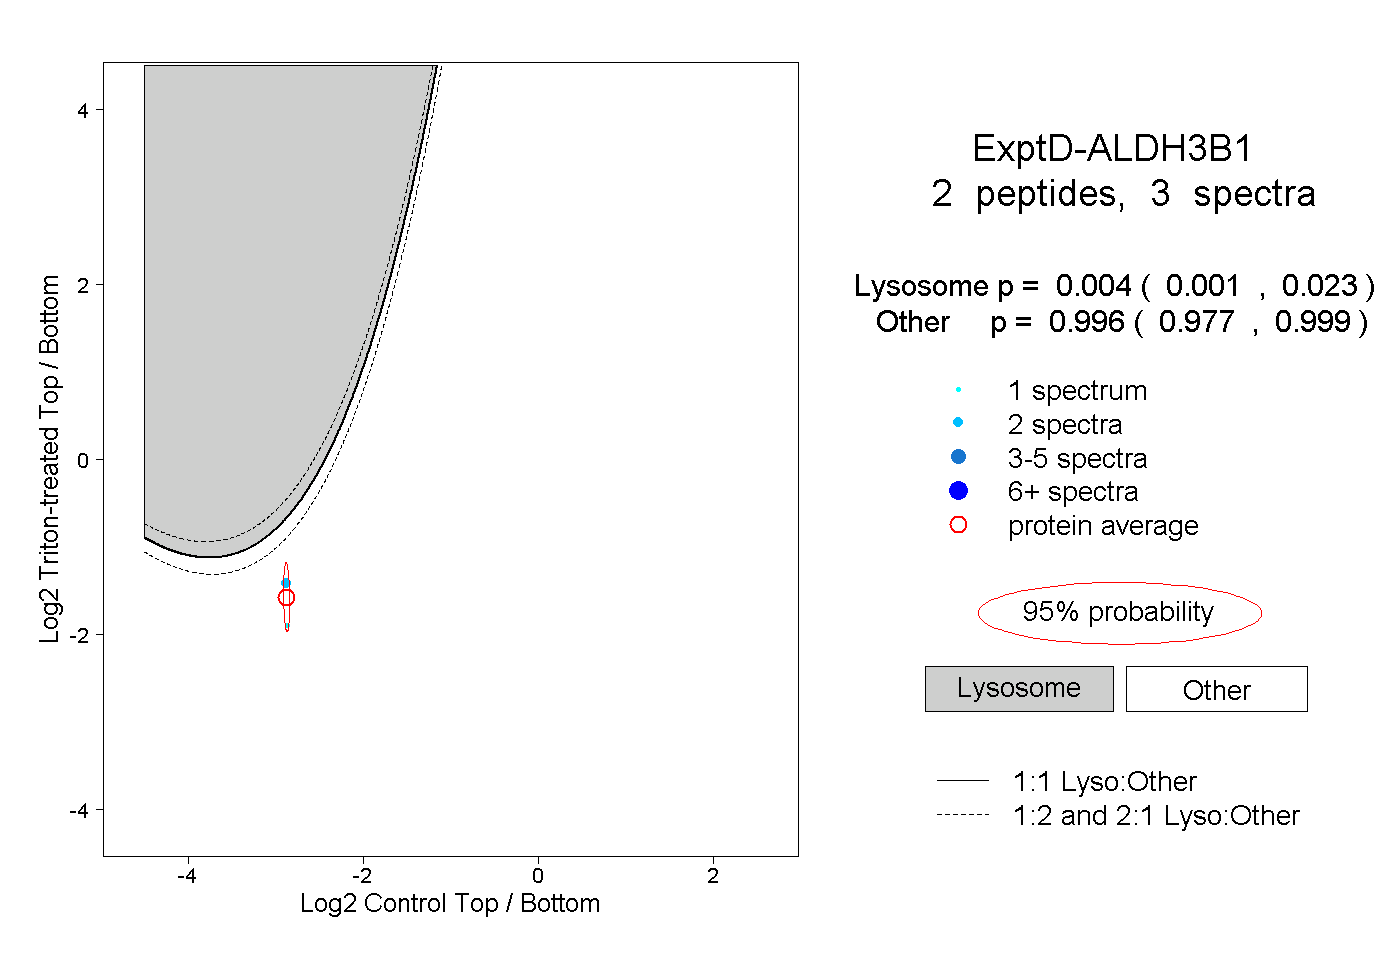 |
0.004 0.001 | 0.023 |
0.996 0.977 | 0.999 |