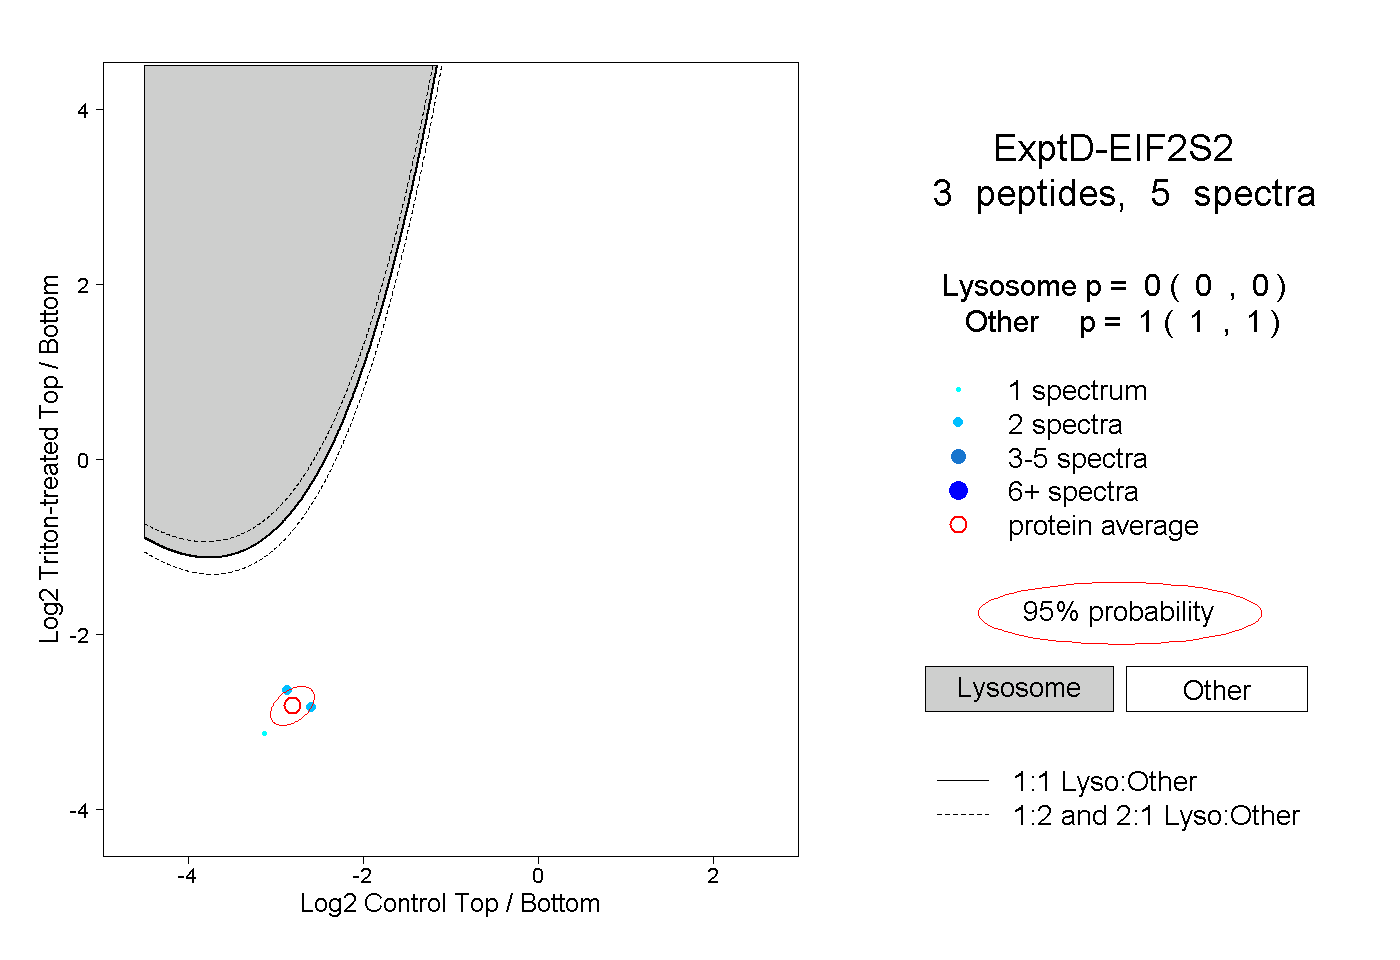
13
13peptides
spectra
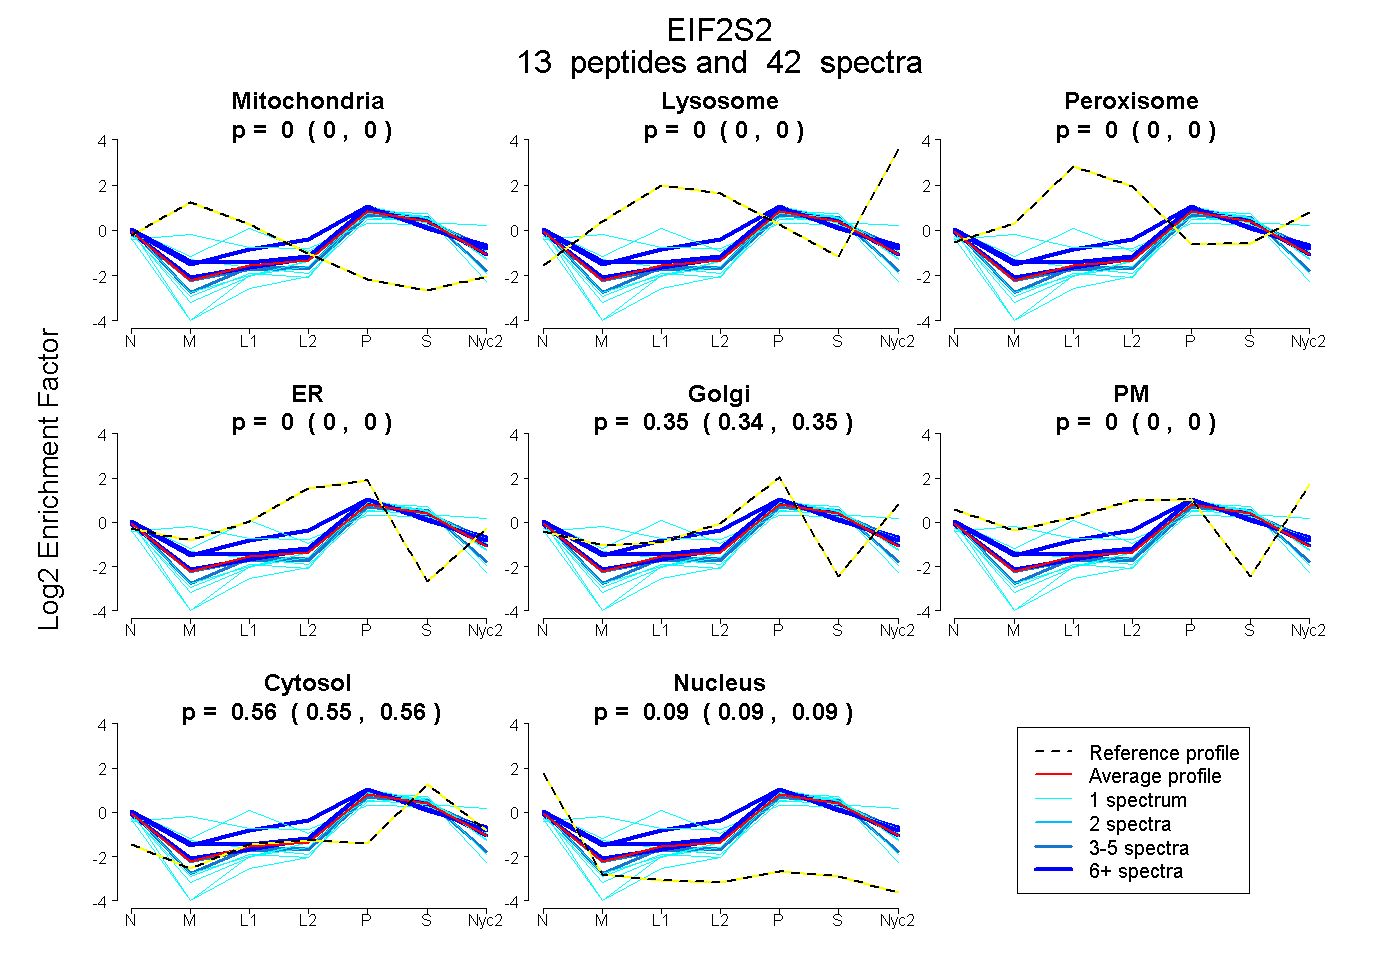
0.000 | 0.000
0.000 | 0.000
0.000 | 0.000
0.000 | 0.000
0.344 | 0.355
0.000 | 0.000
0.555 | 0.564
0.085 | 0.094
5peptides
spectra
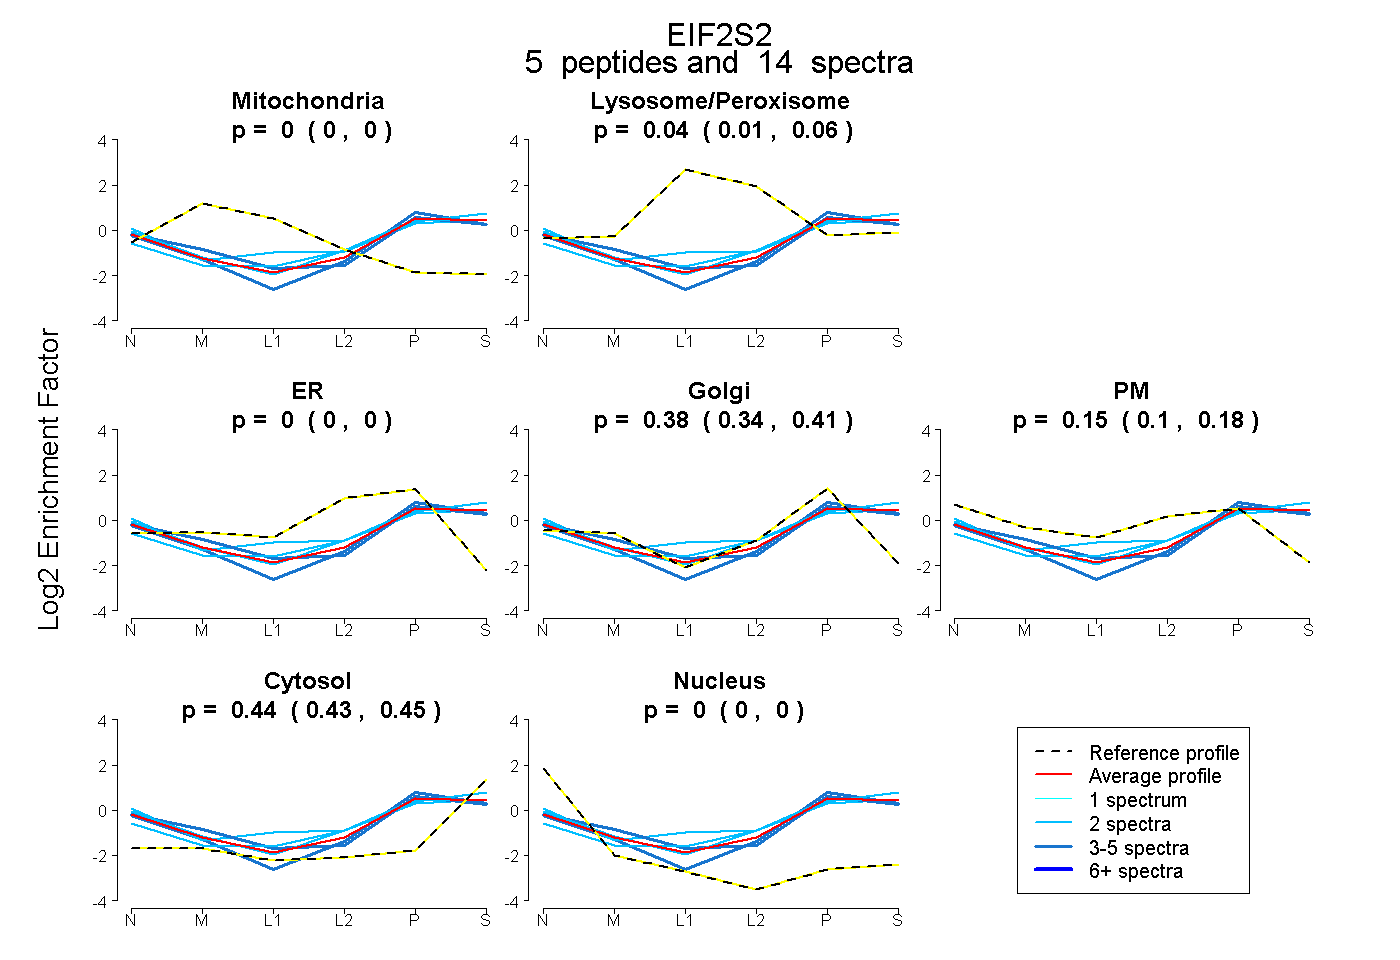
0.000 | 0.000
0.007 | 0.060
0.000 | 0.000
0.343 | 0.406
0.101 | 0.184
0.428 | 0.452
0.000 | 0.000
10peptides
spectra
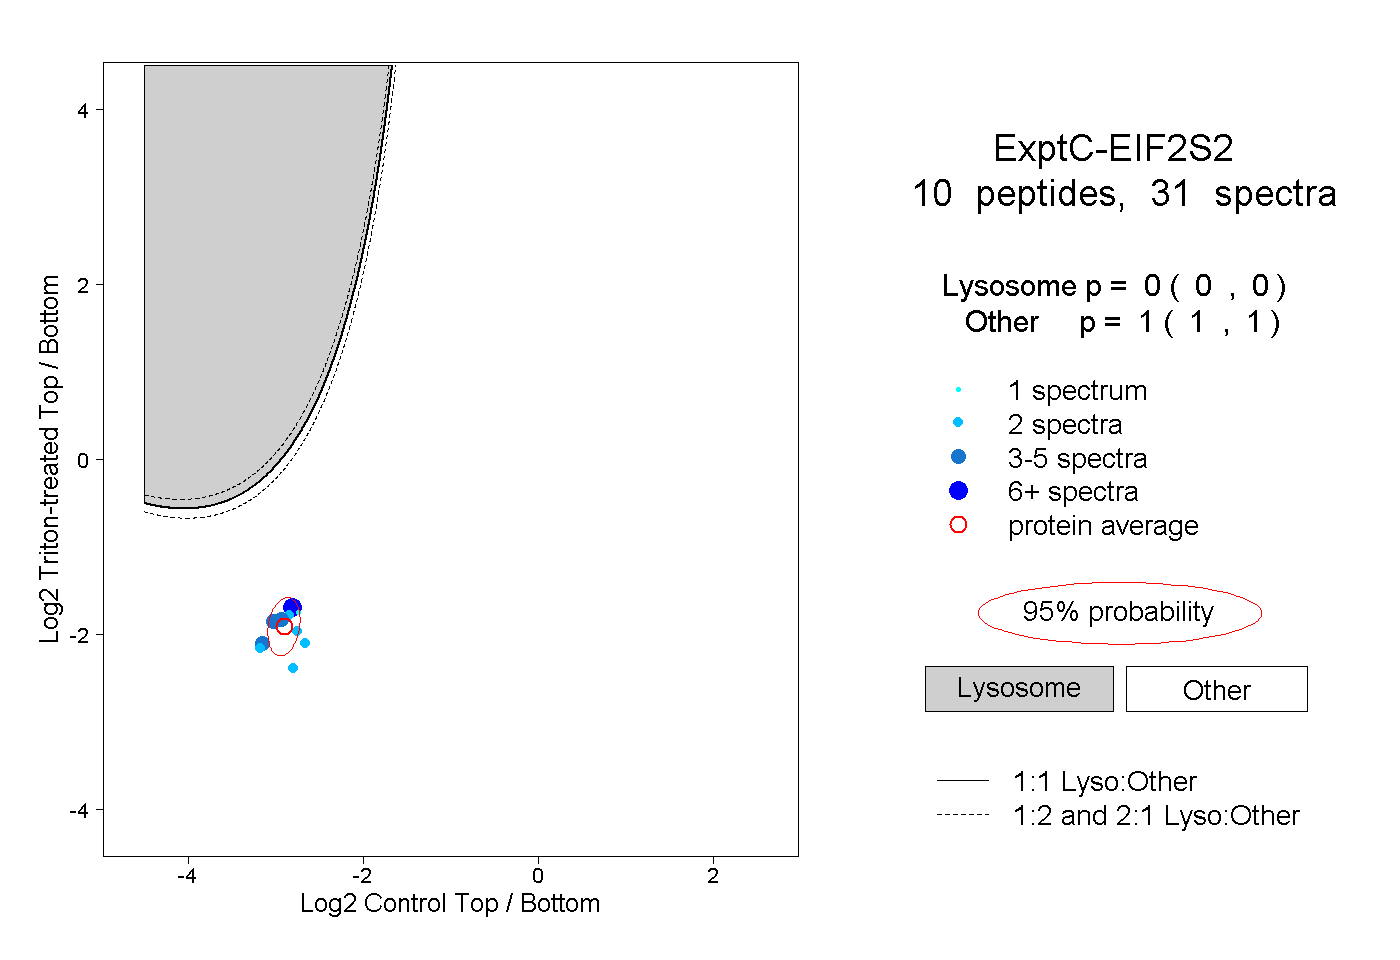
0.000 | 0.000
1.000 | 1.000